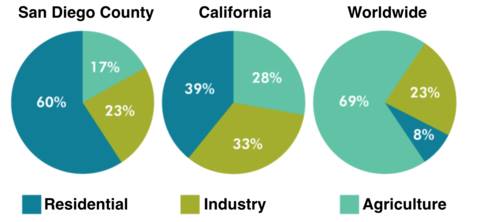
The pie charts illustrate the differences of the water expenditure in two states are San Diego and California and it's expanding in the rest of the world. It is noticeable that residential sector supplies the majority of water expenditure in both San Diego and California, while agriculture is accounted for the most expenditure in every country around the world.
Water spent by San Diego in the residentional sector are three-fifth. Industry sector contributions, which is the second largest of water spending, bring in 23% of overall expenditure, and this is followed by the agriculture sector, at 17%. While in California, there are also three sectors of water expenditure namely residential, industry and agriculture, accounting for 39%, 33%, and 28% respectively.
However, the agriculture is the dominant of the water expenses in the rest of countries, it is estimated around four-fifth. By contrast, the residential contributes only 8%, coupled with industry as the second highest of water spending at 23%. (157 words)
note: kindly drop your comments followed with clear explanations

Task_3.jpg
