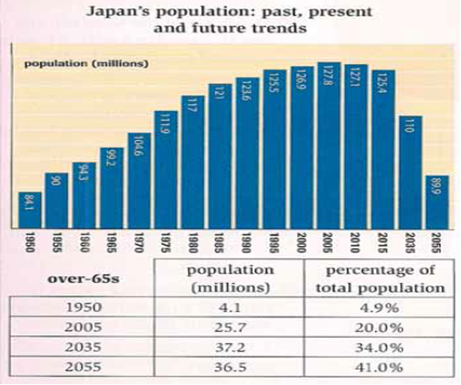
The given bar chart and table perform the information regarding the number of population in Japan during more one century from 1950 to 2055 years, measured by percentage and millions. Overall, it is really important to notice that the highest population happened in year 2005 and experienced change after restriction having children that will be predicted downward in the future years.
Initially, the amount of inhabitation stood at 4,1 millions people in the fisrt year which had percentage about one in twenty. Then it was followed in the next years that rose considerably reached 34 % from percentage of total population. Suprisingly, It was the largest one over fourty five years.
Eventually, by implementing a brilliant program, families who live in whole regions of Japan have to obey the rule to limit the number of children. As the result, the population of resident is decreasing gradually reached 125,4 millions people in 2005. Interestingly, it will experience an upward enormously in the last year approximately twenty millions percent of total population.

266044_1_o.png
