Unanswered [0]
  

Home / Writing Feedback   % width   Posts: 7


IELTS Writting task 1: UK adolescents following a vegetarian diet.


vandon92 1 / 1  
Sep 15, 2014   #1
Please help me check this. Thank you very much!
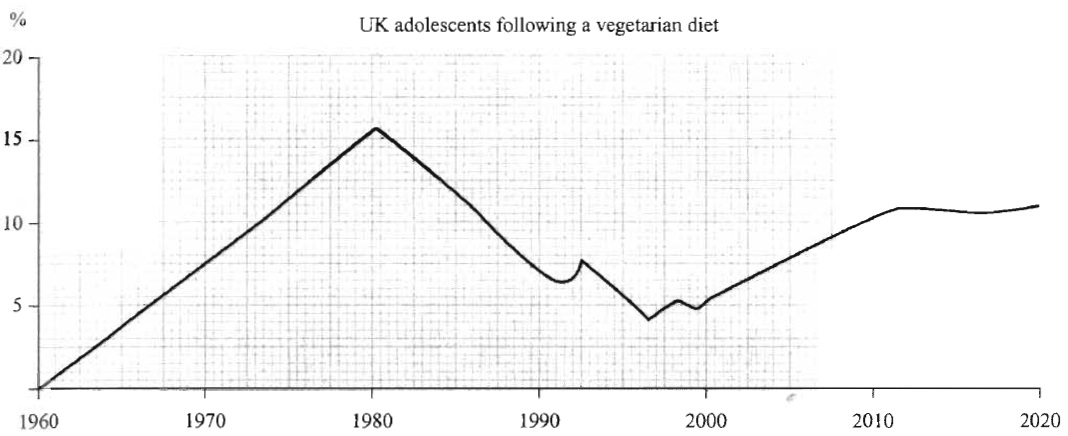
The graph shows the percentage of UK adolescants following a vegetarian diet. Summarise the information by selecting and reporting the main features.

The graph illustrates the proportion of young peoples in UK taking part in a vegetarian diet, from 1960 to 2020. Overall, it can be seen that figure fluctuated over the period, but the trend was still upward. Started at 0% in 1960, the percentage accerelated and reached its highest level of slightly more than 15% in 1980, and this was also the highest peak over the period. Afterward, there was a significant drop in the percentage of UK vegetarian juvenile, from over 15% to nearly 7%. The figure then moved up and down wildly before recovered gradually by around 10% in 2012. Subsequently, the percentage was fairly stable at 12% in 2020.

  • 165873_1_o.jpg


fikri 5 / 310  
Sep 15, 2014   #2
hello, welcome in Essayforum, here to write an IELTS Task I, you must must write at least 150 words which is separated into introduction-body-paragraph
that's we call an essay, so if you just write in a paragraph that's just a paragraph, not an essay,
OP vandon92 1 / 1  
Sep 15, 2014   #3
Hi! Thank you very much for your explanation. I'm just a newbie in IELTS exam and this is one of the homework the tutor gave me. I heard that in the real exam, the writting task 1 would contain about 2 or more graphs like this one. So i wonder how much word i should spend on each graph in order to make my essay look good ?
fikri 5 / 310  
Sep 15, 2014   #4
the writting task 1 would contain about 2 or more graphs like this one. So i wonder how much word i should spend on each graph in order to make my essay look good ?

in IELTS task I, you must write at least 150 words whether the question contains 1 or two graphs. also, you should spend 20 minutes to deal with the task 1
tiaDS 73 / 222  
Sep 16, 2014   #5
The graph shows the percentage of UK adolescants following a vegetarian diet. Summarise the information by selecting and reporting the main features.

Intoduction:
The line graph shows the proportion of teenagers in United Kingdom who have a vegetarian diet between 1960 and 2020. Moreover, it was measured in percentage.

Overview:
It is clear that the percentage of adolescents who get involved in a vegetarian diet in United Kingdom fluctuates. Then, this figure shows a slight incline in the over of the period.

I suggest you to read as much as you can, the sample answers of writing task 1.
YULIS 9 / 16  
Sep 17, 2014   #6
on task 1 in ielts,, i think you should make some concluding on the last paragraph. and at least 150 words.
eddies [Contributor] 25 / 1170  
Sep 17, 2014   #7
You write well. However, you need to pay particular attention to the appropriate language of change.
Please allow me to describe this line graph:

In 1960, the percentage of adolescents following a vegetarian diet stood at 0%. However, over the following twenty years, there was a sudden increase, with the rate of reaching a peak 15% in 1980. Next, the lowest point was reached on the line graph in 90s, but then increased gradually from 5% to 10% between 2000 and 2001, a rise of about 5% in 10 years. By 2020, the proportion is predicted to remain virtually unchanged


Home / Writing Feedback / IELTS Writting task 1: UK adolescents following a vegetarian diet.
ⓘ Need Writing or Editing Help?
Fill out one of these forms for professional help:

Best Writing Service:
CustomPapers form ◳

Graduate Writing / Editing:
GraduateWriter form ◳

Excellence in Editing:
Rose Editing ◳

AI-Paper Rewriting:
Robot Rewrite ◳