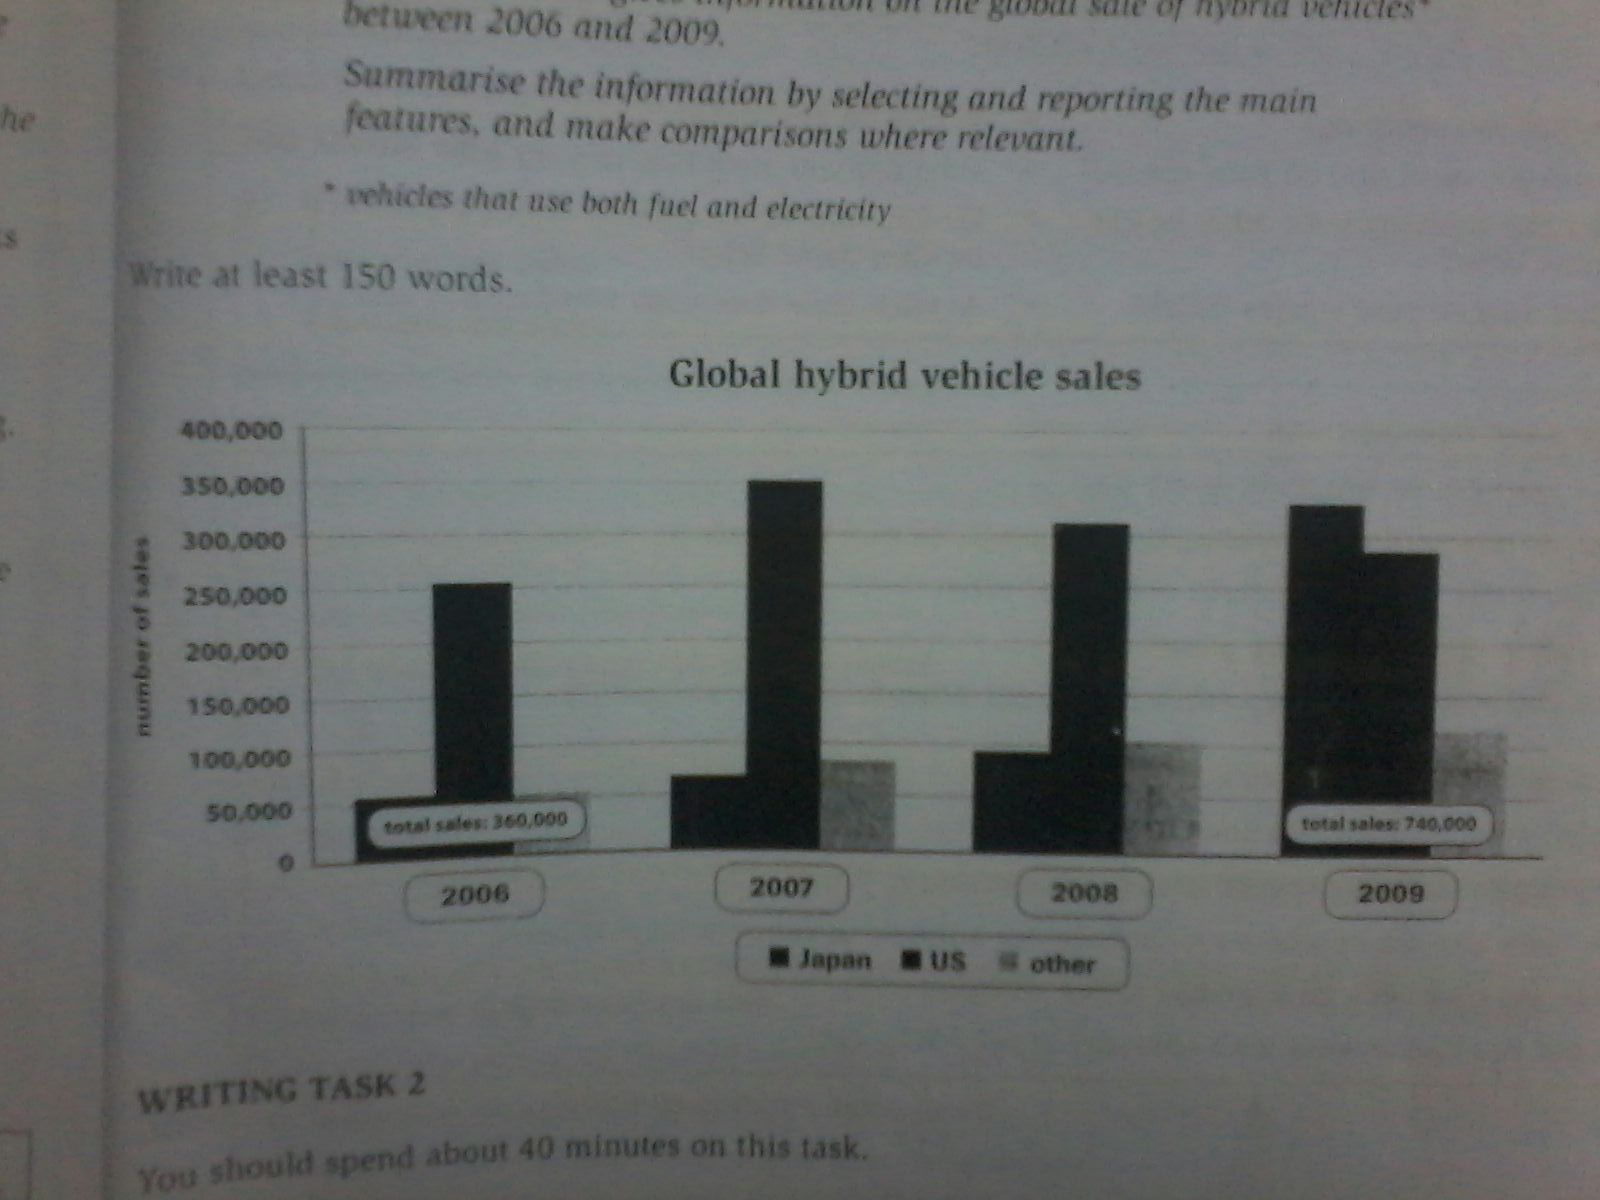
The given bar chart illustrates data about global sale of transports using both fuel and electricity in USA, Japan, and other countries from 2006 to 2009. Overall, it can be seen that America had the largest number of hybrid vehicle sale in the first three years, but Japan came out top in the last year. Also, the total sales in 2009 increased just over two times than that in the first year.
In 2007, the number of America's hybrid transportation sales rose rapidly from 250,000 to 350,000. It was the highest level of sales during four-year period. Unfortunately, it decreased to almost 300,000 in 2008 and dropped again in 2009 to 280,000.
In contrast, Japan had upward trend over four years. In 2006, it had the same number of sales as other countries, only just over 50,000 sales. Then, the sale number increased slightly in 2007 and 2008. 2009 saw a dramatic increase in Japan's sale number by 250,000. In that year, Japan dominated the sale of hybrid vehicle. Meanwhile, other countries only increased steadily during the period.

IMG20160201WA0001..jpg
