someoneishere
Feb 9, 2023
Writing Feedback / Expenses for mobile phones, domestic and global fixed-line, and services in America [2]
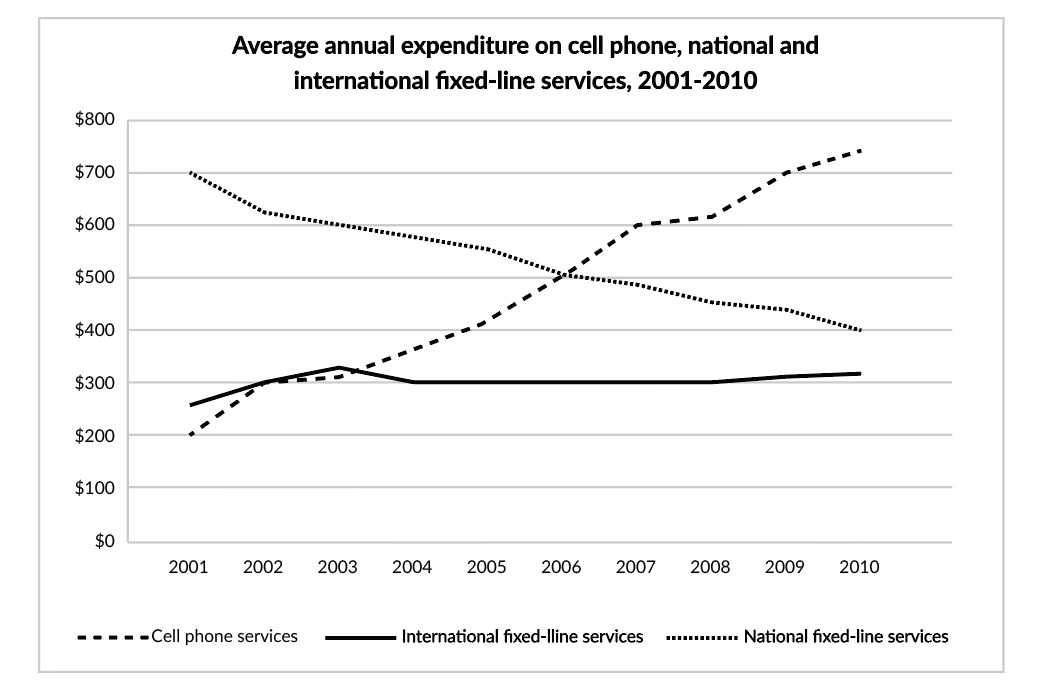
The provided line graph illustrates the anally average financial consumption of mobile phones, domestic and global fixed-line, and services in America from 2001 to 2012.
Overall, the significant rise in expenditure on the national landline, in contrast, witnessed the dramatic fall of the oversea landline. Especially, cell phone services cost a stable amount and remained the lowest.
In 2001, there was a contrasting trend of calling online, international fixed-line, and domestic permanent lines by US residents. The highest was the consumption of mobile phones at 700$, opposite the just 200$ above of the other services. For 5 years, Americans spent enormous money on the use of cell phones, while the expenditure trend of the nation decreased sharply and met the resemblance with mobile phones approximately at 500$ which was two and a third higher than the past amount of telephones. Also, there were unchanged financial American consumers throughout this period at 300$.
On the other hand, from 2006 to 2010, the average money for calling online services climbed considerably and reached its peak at more than 700$. US inhabitants these years prefer mobile telephones more than 1.5 times the landlines in their country with a percentage of about 400$. Finally, it is just a small growth of expenditure on global fixe-line in the US.
The graph below shows consumers' average annual expenditure on cell phone, national and international fixed-line and services in America between 2001 and 2010.
phone expenditures and fixed-line services in 2001-2010
The provided line graph illustrates the anally average financial consumption of mobile phones, domestic and global fixed-line, and services in America from 2001 to 2012.
Overall, the significant rise in expenditure on the national landline, in contrast, witnessed the dramatic fall of the oversea landline. Especially, cell phone services cost a stable amount and remained the lowest.
In 2001, there was a contrasting trend of calling online, international fixed-line, and domestic permanent lines by US residents. The highest was the consumption of mobile phones at 700$, opposite the just 200$ above of the other services. For 5 years, Americans spent enormous money on the use of cell phones, while the expenditure trend of the nation decreased sharply and met the resemblance with mobile phones approximately at 500$ which was two and a third higher than the past amount of telephones. Also, there were unchanged financial American consumers throughout this period at 300$.
On the other hand, from 2006 to 2010, the average money for calling online services climbed considerably and reached its peak at more than 700$. US inhabitants these years prefer mobile telephones more than 1.5 times the landlines in their country with a percentage of about 400$. Finally, it is just a small growth of expenditure on global fixe-line in the US.
The graph below shows consumers' average annual expenditure on cell phone, national and international fixed-line and services in America between 2001 and 2010.

IELTSWritingTask1.png

