Unanswered [16] | Urgent [0]
  

Posts by juhuihjijuh [Suspended]
Name: Aras
Joined: Jan 14, 2020
Last Post: Jan 28, 2020
Threads: 3
Posts: 8  
Likes:
From: Kurdistan
School: I graduated last year

Displayed posts: 11
sort: Latest first   Oldest first  | 
juhuihjijuh   
Jan 28, 2020
Writing Feedback / Ielts essay on land availability in countryside [5]

What makes me feel positive about your essay is that you have a wide range of vocabularies, proper ways to make sentences and ideas. When it comes to the structure, a bit more practices and reading some professional model answers levels you up. Good luck.
juhuihjijuh   
Jan 24, 2020
Writing Feedback / The amount of China and India's population from 2000 until now and the predicted number up to 2050 [3]

Hello everyone, I hope you can provide me with your feedback.

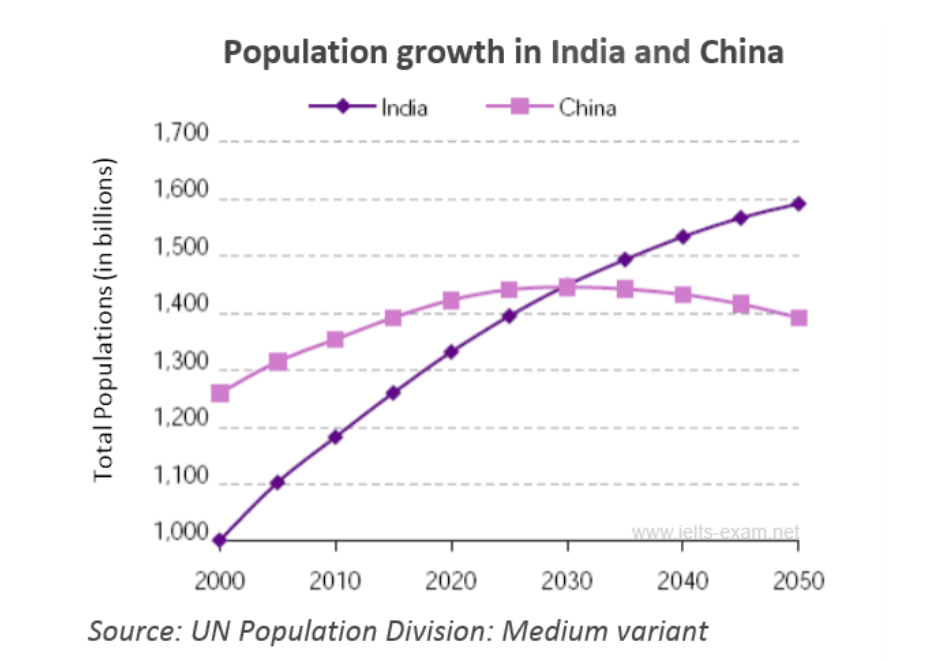
IELTS TASK 1 Population in India and China since the year 2000


The line graph illustrates the amount of China and India's population from 2000 until now and the predicted number up to 2050. Overall, it is very clear that the population in both countries has been rising and will continue growing except Chinese population which will fall afterwards.

At the beginning of the period, the number of Chinese people in China was more than India's population by being 1.200 and 1.000 billion respectively. The figures has been growing up to the moment by having almost 1.500 billion for china and nearly 1.350 billion for India.

In the future, the graph expects that population will continue growing in both countries and it will become about 1.420 by 2030. After 2030, the number of people in China starts declining and it becomes almost 1.400 in 2050. But when it comes to India, the population will continue to grow even after 2030 which exceeds China in that respect. It is expected that India's population will reach almost 1.600 billion in 2050

Note: 163 words


juhuihjijuh   
Jan 24, 2020
Writing Feedback / Export earnings 2015-2016. IELTS writing task 1 [3]

I suggest you to search for more model task 1 essays to have a smoother approach in writing. You've taken an excellent step, but there is still space for improvement.
juhuihjijuh   
Jan 22, 2020
Writing Feedback / IELTS TASK 1 - the number of live births per thousand of population per year in China and the USA [5]

In general, It is so good, however mistakes can be found everywhere unless you are a very experienced writer. Even I make mistakes and ask for feedback in this forum.

It is a good idea to clarify the starting point figures, interesting changes and the figures at the end of the period. You've done the first two ones but you have not fulfilled the third requirement.
juhuihjijuh   
Jan 22, 2020
Writing Feedback / IELTS task 1 - comparing three types of food prices [8]

Thanks a lot
I will take what you said into consideration. But, could you please tell me how to make a link between the consumer-price index and the foods? Is the food under the index price line means it reduced in price and the ones above the line became higher in price? It is just like a nightmare to me. I hope you can show me the correct link between the price and and the foods.
juhuihjijuh   
Jan 21, 2020
Writing Feedback / IELTS task 1 - comparing three types of food prices [8]

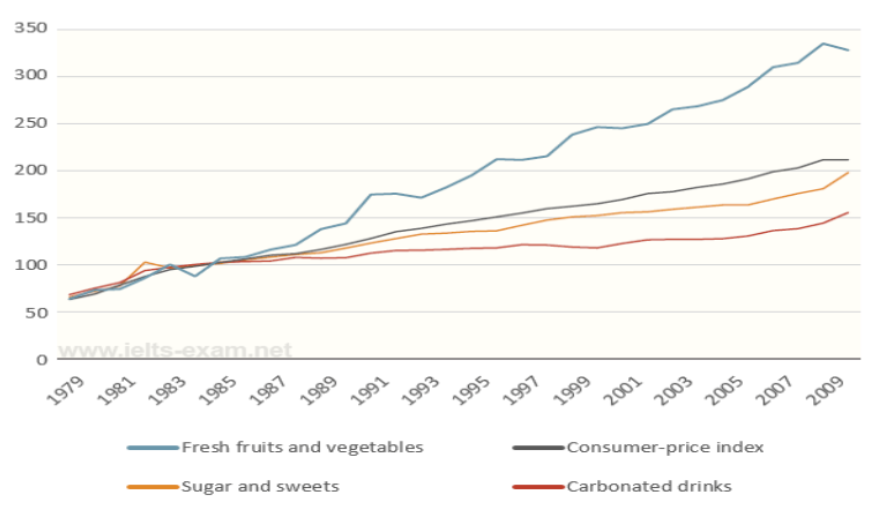
various food products and their price index


Hello every one
This is the first time I do this type of line graph that compares the items with price index. I hope you can tell me whether I have created a correct link between the foods and the price index.

The line graph illustrates how the price of fresh fruits and vegetable, sugar and sweets and carbonated drinks changes from 1979 to 2009. Overall, the price of all the tree foods changed over the period, but fresh fruits and vegetables' value is remarkable.

In 1979, the prices of fresh fruits and vegetable, sugar and sweets and carbonated drinks were around 65. From the beginning of the period to 1981 all the foods showed a steady rise and got stuck in around 80. From 1981 on, both sugar and sweets and carbonated drinks experienced some fluctuations by being higher and lower than 100 and then it followed by a constant rise the rest of the time to be almost 200 and 2010 by 2009.

Fresh fruits and vegetables price underwent a calm growth from the beginning of the period to 1983. From 1983 to 2009 it experienced some ups and downs but

continued climbing and stopped at nearly 335 in 2009 which is the highest among all the three types of food.


juhuihjijuh   
Jan 14, 2020
Writing Feedback / IELTS line graph - task 1 - thefts per thousand vehicles in four countries between 1990 and 1999. [4]

Hello everyone, I will be really happy by telling me your feedback about my writing task one.

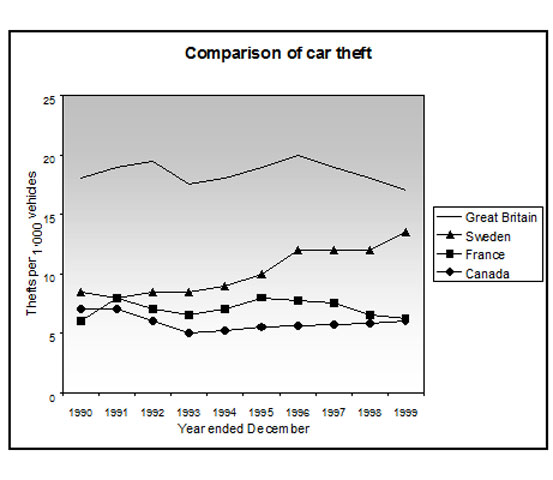
comparison of car theft


The line graph illustrates car thefts in the UK, Sweden, France and Canada from 1990 to 1999. Over all, despite some fluctuations, car theft almost remained the same in Great Britain, France and Canada. While the rate in Sweden rose during the period given.

In 1990, the rate of stealing cars in France and Canada were about 6 and 7 subsequently. Then they both experienced some ups and downs to be stable at nearly the same amount at the end of the period. In addition to that, car theft in the UK was almost 18 in 1990, then the rate underwent some fluctuations that made a slight change to become about 17 in 1999.

On the other hand, the number of stolen cars in Sweden was about 8 in 1990 and then it showed a steady rise to 1996. From 1996 it remained the same until 1998 which followed by another a gradual growth to be to hit nearly 14 at the end of the period.


Do You Need
Academic Writing
or Editing Help?
Fill in one of the forms below to get professional help with your assignments:

Graduate Writing / Editing:
GraduateWriter form ◳

Best Essay Service:
CustomPapers form ◳

Excellence in Editing:
Rose Editing ◳

AI-Paper Rewriting:
Robot Rewrite ◳