Unanswered [5] | Urgent [0]
  

Posts by Nguyet Tran
Name: Nguyet
Joined: Jan 31, 2020
Last Post: Feb 23, 2020
Threads: 4
Posts: 8  
Likes: 1
From: Vietnam
School: HCM Open University

Displayed posts: 12
sort: Latest first   Oldest first  | 
Nguyet Tran   
Feb 23, 2020
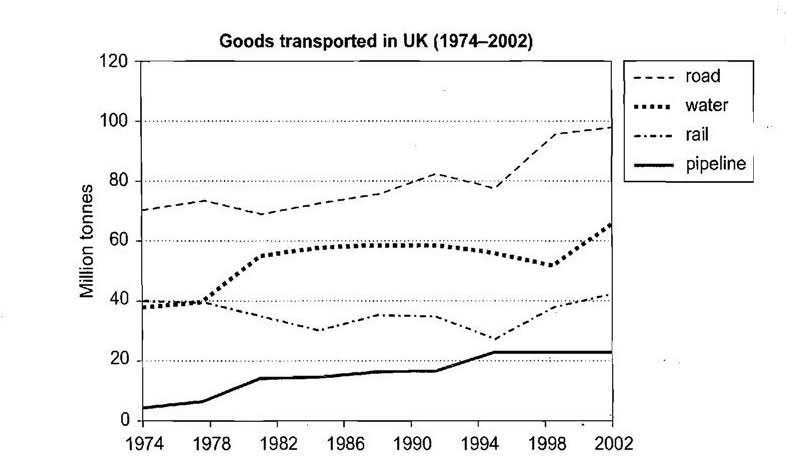
Writing Feedback / How many tonnes of goods (road, water, rail, pipeline) transported in the UK from 1974 to 2002 [3]

Ielts Writing Task 1:

The amount of goods transported in the UK from 1974 to 2002


The line graph illustrates how many tonnes of goods (road,water,rail,pipeline) transported in the UK from 1974 to 2002. Overall, road was the most popular good shipped in the UK while pipeline was the least. The amount of water and rail delivered in this country began almost the same but at the end, this figure was higher with water.

In 1974, UK transported about 70 tonnes of road, whereas other 3 goods were just 40 tonnes and under. After some plunges, it finally reached a peak at almost 100 tonnes in 2002. In contrast, starting with approximately 5 tonnes, pipeline experienced a slow growth by generally 10 more tonnes during 28 years given in the graph.

With regards to water and rail, the number stood at nearly 40 tonnes for both in the first and second period. From 1982, UK transported more water (increased by 20 tonnes) and less rail (decreased by 10 tonnes). Apart from a slight fall of marginally 50 tonnes in 1998, the amount of water kept up to around 65 tonnes compared with more than 40 tonnes in rail.


Nguyet Tran   
Feb 23, 2020
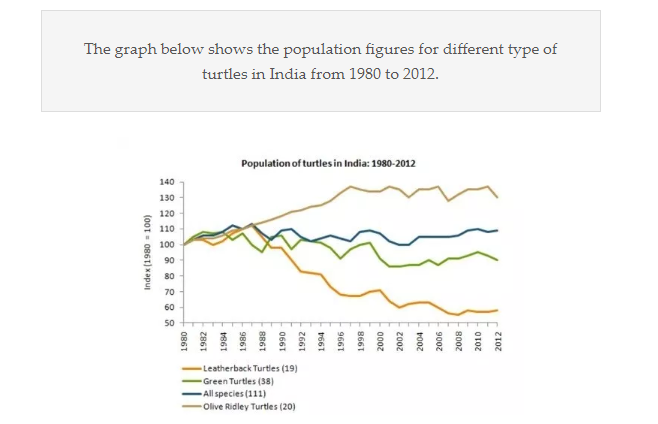
Writing Feedback / Turtles in India (four different species) - IELTS Writing Task 1, line graph [3]

This represent (Noun - Verb agreement) an increase of 30 turtles

"In contrast, LeatherBack ... and 90 turtles." ...etc..

I'm confused which period that you mentioned in this sentence. I think it would be better if you can state the time frame.
Also, there was some outstanding data in this chart that you can indicate such as: the peak of number of Olive Ridley Turtles in 1997 and the fall of LeatherBack Turtles in 1987.
Nguyet Tran   
Feb 20, 2020
Writing Feedback / Self Study Ielts Task 1: Population for different type of turtles in India from 1980 to 2012 [4]

analysis of indian turtles population


The line graph illustrates the number of varied turtle types in India from 1980 to 2012. Unit is measured in index.

Overall, during 32 years since 1980, there was a dramatic drop in the number of Leatherback Turtles. Olive Ridley Turtles in contrast, increased significantly in figures. The other two types of turtles (Green Turtles and all species) had their index fluctuated over the period.

With regard to Leatherback Turtles, their population reached a peak of about 110 in 1987. Likewise, all species of turtle number had the same trend in this period. However, while the amount of all species turtle still remained nearly 110 in 2012, this index in Leatherback Turtles was a free fall (generally 60).

Meanwhile, Olive Ridley Turtles population far exceeded to marginally 140 in 1997 until it reduced to relatively 130. In addition, the statistics of Green Turtles experienced a slight decrease recorded at 90 in the last year.


Nguyet Tran   
Feb 20, 2020
Writing Feedback / WRITING TASK 1 - number of graduates of different gender in Canada [4]

"Tree years later" --> I think you missed the typing, it should be "three years later"
And again, you used "more and more" in the 2nd and last paragraphs. Many sentences started with "there were...", "the number of...".
Recommend: the amount of, the figures, the statistic, ....
Nguyet Tran   
Feb 20, 2020
Writing Feedback / The line graph below illustrates how much waste was generated per year by three different companies [3]

Hi shinxg!
The introduction and overview caused me a bit confusion. Firstly, the unit are not mentioned (tonnes) in the first paragraph. It would be beter if you can make the comparison clearer, instead of "less and less" or "more and more".

It can be seen that you seem focus too much on the figures of each year in a certain company without comparing it with others. Using more vebs besides "generated" would help a better writting.
Nguyet Tran   
Feb 16, 2020
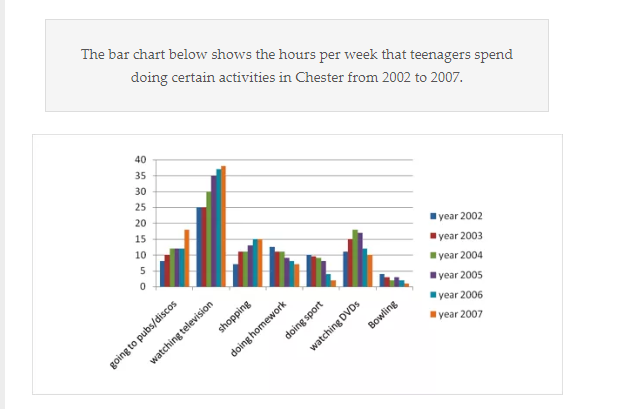
Writing Feedback / Ielts Writing Task 1: the hours per week that teenagers spend doing certain activities in Chester [3]

popular activities in Chester from 2002 to 2007


The bar chart illustrates the amount of time that adolescents dedicated for particular activities weekly in Chester from 2002 to 2007. Units are measured in hours.

Overall, it is noticeable that the youngsters spent most hours for watching TV over the years. Meanwhile, time consuming for bowling consistently stood at the lowest. In addition, these activities time such as going to pubs and shopping had climbing trends whereas doing homework, sport, watching DVDs kept decreasing throughout the period.

In 2002, time for watching television already reached the highest rate compared to other activities which accounted for 25 hours per week. This statistic still remained the same in 2003 then rose gradually to a peak of around 37 hours in 2007. In contrast, 2002 saw just under 5 hours in bowling each week. During the timeframe, there were fluctuations on the consuming time until it dropped to nearly one hour weekly in 2007.

Regarding to other leisure activities like going to pubs and shopping ,the figures showed significant leaps, especially discos time rocketing to around ten more hours from 2002 to 2007. The remaining activities fell gradually excepting for watching DVDs which recorded a rise of about 17 hours in 2004, however, 2007 witnessed a plunge of exactly 10 hours,nearly the same with the start of the period.


Nguyet Tran   
Feb 16, 2020
Writing Feedback / WRITING TASK 1 - number of graduates of different gender in Canada [4]

Ielts Task 1:

As this data is in the past, you should use past tense consecutively.
You should stated the unit measured in the writing.
Use more synonyms instead of male and female only.
I can see the repeat "more" many times in your writing, it would be better if you can use variety of comparisons.

Thank you.
Nguyet Tran   
Feb 13, 2020
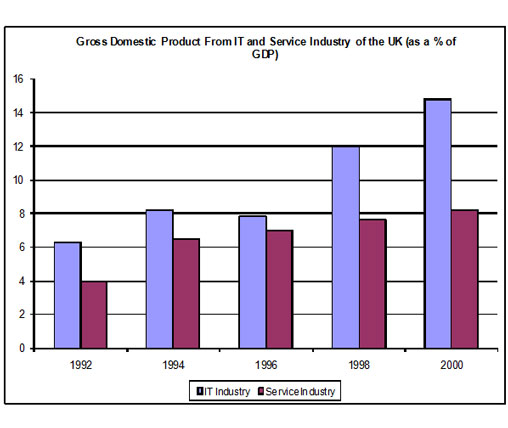
Writing Feedback / Ielts Task 1: Gross Domestic Product including IT and Service industries in the UK from 1992 to 2000 [4]

components of GDP in the UK


The bar chart illustrates Gross Domestic Product including IT and Service industries in the UK from 1992 to 2000. Units are measured in percentage.

Overall, it can be seen that the proportions of GDP from IT industry are higher than that of from Service industry. Furthermore, the figures showed an increase throughout the year in Service industry where as GDP from IT industry's percentage was fluctuated slightly.

Regarding to the statistics of GDP from IT industry, there was a leap from more than 6 percent to marginally above 8 percent between 1992 and 1994. However, 1996 saw a small plunge which was just a little bit under 8 percent . After that, it kept gradually jumping up to exactly 12 percent in 1998 and around 15 percent in 2000 which was doubled in comparison with the year 1996.

In terms of Service industry, the proportions of GDP in this field grew stably. In 1992, it stood at absolutely 4 percent and moved upward to approximately 8 percent at the end of the period.


Writing
Editing Help?
Fill in one of the forms below to get professional help with your assignments:

Graduate Writing / Editing:
GraduateWriter form ◳

Best Essay Service:
CustomPapers form ◳

Excellence in Editing:
Rose Editing ◳

AI-Paper Rewriting:
Robot Rewrite ◳