Unanswered [5] | Urgent [0]
  

Posts by desgit33
Name: Desy Gitapratama
Joined: Jan 18, 2016
Last Post: Jan 28, 2016
Threads: 6
Posts: 3  
From: Indonesia
School: Sepuluh Nopember Institute of Technology

Displayed posts: 9
sort: Latest first   Oldest first  | 
desgit33   
Jan 28, 2016
Writing Feedback / The cause of unhealthy lifestyle among youth generation [2]

Many children these days have an unhealthy lifestyle. Both of schools and parents are responsible for solving this problem. Do you agree or disagree?

Healthy lifestyle should be kept on children behavior. It is argued that parents and teachers have to solve this problem. While this is true, I would argue that other factors such media, health authorities, and government also play important roles.

It is necessary that parents and teachers are to help their children's lifestyle. This is because they have more access to control their kids to eat healthy food, for instance, teachers are more likely to not be care rather than cleaning the area of school, while parents are concern on giving children the money for getting a food without keeping what will children buy. This results in teenagers could not access a clean area in the school and a healthy food. There is no doubt that parents and teachers are bound to control children not to eat unhealthy food and stay in the clean area.

However, other factors should not be neglected. Firstly, lack of the media information such as hand washing with soap campaign makes children do not have a good daily behavior how important hand washing for their health. Also, health authorities have responsibilities to inform how to access a sedentary lifestyle for children by course about how to bring up the children. Not only this, government are to keep the good criteria of food. The criteria of food has to be implemented well in every place which can be reach by the kids.

In conclusion, the idea of unhealthy lifestyle happens since parents and teachers do not keep teenagers. While this is acceptable, imperative that all factors should be taken into consideration.
desgit33   
Jan 28, 2016
Writing Feedback / 'level of blissfulness' - IELTS TASK 1 : HAPPINESS RATING CHARTS [3]

... the blissfulness level of individuals who haveHAVING married and stillSTILL HAS MEANING NEGATIVE single, categorized by age ...
... the bliss level of married individuals who haveHAVING either children or no ...

... people in the age 50-64 age group sawSHOW lower by 5% compared to ...

... of mated couples' happiness, people who haveHAVING children under 18 years ...
Meanwhile, individuals who haveHAVING children aged 18 years ...
desgit33   
Jan 27, 2016
Writing Feedback / The cause of increasing violent crime among youth generation [2]

Recent figures show an increase in violent crime among youngsters under the age of 18. Some psychologist claim that the basic reason for this is that children these days are not getting the social and emotional learning they need from parents and teachers. To what extent do you agree or disagree with this opinion?

More attention should be paid on how to prevent people aged 18 and less doing crime. It is argued that the rise in the rate of juvenile delinquency happens due to lack of parents and teachers' surveillance. While this is true to some extent, I would argue that other factors such media, poor family background, and environment also play important roles.

It is necessary that parents and teachers are to responsibility to this issue. This is because they have more time to handle the behavior of their children both in the school and at home, for instance, teachers are more likely to spend their time prepare materials rather than monitor children behavior, while parents are concern on children's appearance without teaching how to behave well. This results in children doing their activities freely without any supervision. There is no doubt that parents and teachers are to maintain children not to do criminal activities.

However, other factors should not be neglected. Firstly, media such as television gives bad example by broadcasting action movies which can be watched by teenagers anytime. This TV programs bring negative impacts on child development. Also, poverty rates among the younger generation lead stress that can give effect to theft, robbery, or other violent acts. Poverty reduces the challenge to reach education which can access to get jobs or role models. Not only this, environment where kids live having access to bring negative phenomena. The availability of illegal drugs around children support children to be criminal.

In conclusion, the significant increase of crime rate happens since parents do not keep teenagers under surveillance. While this is thoroughly acceptable to some extent, I would claim that other factors should be taken into consideration, it is necessary that government should launch numerous program to attempt to lower that rate.
desgit33   
Jan 21, 2016
Writing Feedback / A Breakdown of Household Consumption [2]

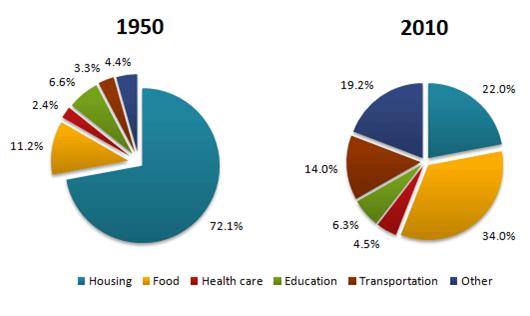
The pie charts below show the average household expenditures in a country in 1950 and 2010.
A breakdown of the proportion of the average of household consumption in 1950 and 2010 is presented in pie charts. At first glance, the highest number of homely activity were housing and food on the different year. While, there were housing, food, health care, education and transportation as the subject of household activity.

Moving to a more detailed analysis, housing in 1950 was the biggest number of household consumption. That was different with the number of housing in 2010. However, 1950 was larger than 2010 between 72.1% and 22.0%. However, 1950 consumed three times more housing than 2010. In contrast, 2010 showed that food was the majority number just less than a third of the percentage. Then, 2010 showed the number of food larger than 1950. Followed by, housing increased dramatically as the second biggest group during six decades.

Subsequently, there were many steady rise from 1950 to 2010 such as transportation, health care and others subject. Transportation rose steadily from 3.3% to 14.0% over six decades. Transportation was larger than education in 2010. However, education was consumed in 2010 smaller than in 1950, the range around less than one in twenty.


  • the_pie_charts.jpg
desgit33   
Jan 21, 2016
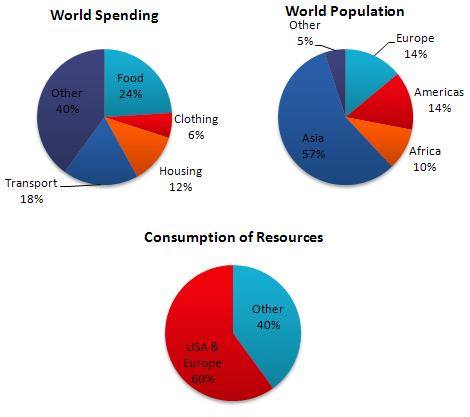
Writing Feedback / Proportion of World Expense, Amount of The world Population and Utilisation of Sources [3]

The bar charts bellow illustrate THE proportion of world (...) of sources in the four countinentCONTINENTS and are calculated by percentage.
... asia people is the highest NUMBER IS compared the others. On the other hand, the people who liveLIVING in USA & Europe show THE dominant in consumtion of sources .

Move to detail,MOVING TO A MORE DETAILED ANALYSIS,withTHE total OF population at 28%. People inFROM America and europe utilize (...) in the other continent containtSUCH ASof asia, africa, and the other continent at 72% but consumeCONSUMING source just 40%. It meanMEANSinTHAT america and europe double of twist compared with total in habitanINHABITANTSinFROM asia, africa, and the other continent.

Turning to THE world spending, eventhoughEVEN THOUGH food haveHAS THE percentage OF.... at 24% but it is tillSTILL lower TAHNcampared other expenditure tahthave at 40%. Whilst, don't forget comma after conjunctionTHEtranspotTRANSPORT expenditure is in the third position witWITH THE percentage at 18%. The lowest world spending is cloting withCLOTHING at 60% .
desgit33   
Jan 21, 2016
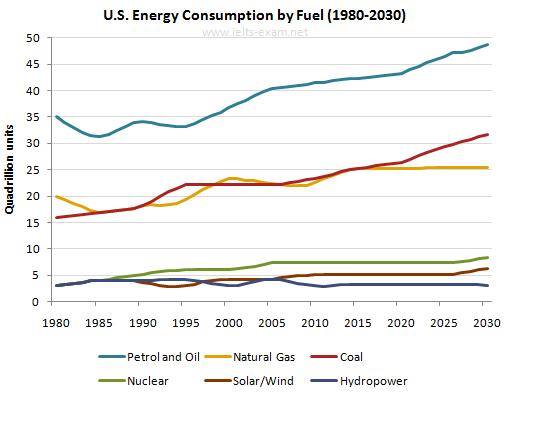
Writing Feedback / Several kinds of fuel consumed by American citizens [2]

... fuel consumed by American citizens per yearTEN YEARS from 1980 to 2030 as a projectedPROJECTION year, a 50-year period ...
Next, the useUSING of non-renewable energy was ...

To begin with renewable energy, the useUSING of energy generated from petrol ...
The figure for natural gas and coal showed almostNEARLY a similar trend to the former. AfterwardS, it will remain stable until 2030. ByIN contrast, energy used from solar/wind (...) over the same period in which itCLIMBINGclimbed by 16 from 1980 to 2030.

... nuclear experienced a slight rise and will continue to wentGO up until 2030.
desgit33   
Jan 20, 2016
Writing Feedback / Estimation of using fuels of American [3]

The graph below gives information from Annual Energy Outlook 2008 about consumption of energy in the USA since 1980 with projection until 2030.

The line chart shows how many production of six kinds of fuel based on the amount of people using energy in America from 1980 to be was estimated in 2030 and is measured in trillion units per five years by using Annual Energy Outlook 2008. At first glance, it can be seen that, there has been an upward trend of the using of petrol and oil, natural gas, coal, nuclear, solar or wind and hydropower.

Moving to a more detailed analysis, petrol and oil having the largest number consumed by many American, it began at 35 quadrillion units and was predicted be able to reach the biggest consumption in 2030, around 49 quadrillion units of petrol and oil. There was intersectional both natural gas and coal. In 1980, the production of natural gas was larger than coal, otherwise the prediction in 2030. On the other hand, the production of nuclear, solar and hydropower was similar in 1980. Interestingly, hydropower was projected to be the smallest production in 2030.

Turning to the kind of the fuel, liquid fuels had a large range between petrol and solar based on the trend. American tended to use petrol and oil than solar or wind for the kind of liquid fuels, was proven by using those fuels. In 2030, the production of solid fuels and gaseous fuels will be equal.


  • The_line_chart.jpg
desgit33   
Jan 19, 2016
Writing Feedback / The breakdown of world population balance [2]

The pie charts below show World Spending, World population and Consumption of Resources.

The breakdown of earth consumption, global inhabitants and consumption of suppliers in this universe. Generally speaking, food allocating is given as the highest percentage of the earth consumption, then Asia is biggest population in all continents. Interestingly, people form USA and Europe is the largest number of people as the consumer.

To begin with, the means of spending food is larger than transport having range around 6 percent, then, it shows a great amount of food of world spending with just less a quarter of total. Followed by, housing is the third largest number, at 12 percent of total. Whilst, the percentage of clothing is smaller than housing. Then, just two-fifths is come from other things.

In world population, many people live in Asia, that it makes the biggest population, just less three-fifths percent of total people in this world. Americas and Europe are the second number of the population, at 14 percent of proportion. However, the amount of people in America and Europe is equal. Interestingly, the total of resources as the consumer is belonged USA and Europe, nearly a significant proportion.


  • The_pie_chart.jpg
desgit33   
Jan 18, 2016
Writing Feedback / The number of students interested in lesson [5]

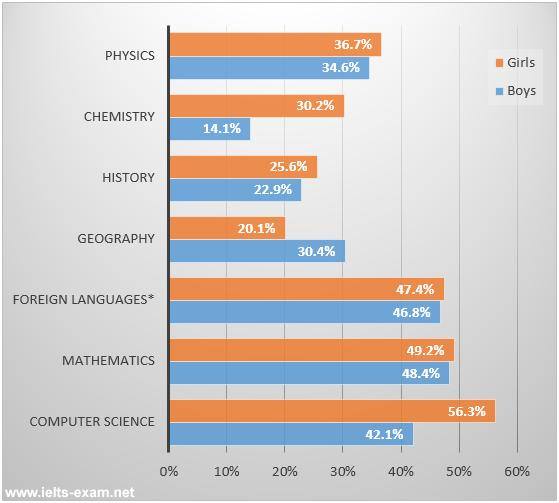
The bar chart below shows the percentage of students who passed their high school competency exams, by subject and gender, during the period 2010-2011.

The bar chart gives information about the statistic of ladies and gentlemen in different lesson who are success in proficiency assessment in secondary school over a 12-month period and is measured in percent for every lesson. At first glance, the percentage of girls who passed in every examination was higher than boys. Interestingly, geography was the single lesson having the percentage of gentlemen was more than ladies.

First of all, the most interesting in subject was computer science by girls. Whilst, the statistic of the girls in computer science over a year was at 56.3% and just 42.1% come from boys in the similar lesson. The second popular subject, just less a half percent of students, illustrated by girls in mathematics and followed by 48.4% of the gentlemen. On the other hand, chemistry was the smallest statistic from all the lesson, the total of boys for far less of the statistic than women. As can be seen from the chart, around less than a fifth percent of the number boys in chemistry.

Turning to the kinds of subject, the majority of the student selected the exact science for the most popular of the lesson, the number of students who interested in exact science was over less than a third percent in every subject. However, the single social science having great number was foreign language, and the percentages of the people choosing that lesson were fairly similar approximately less than a half.


  • The_bar_chart.jpg
Need Writing or Editing Help?
Fill out one of these forms:

Graduate Writing / Editing:
GraduateWriter form ◳

Best Essay Service:
CustomPapers form ◳

Excellence in Editing:
Rose Editing ◳

AI-Paper Rewriting:
Robot Rewrite ◳

Academic AI Writer:
Custom AI Writer ◳