Ptp03
Jun 15, 2020
Writing Feedback / IELTS 1: the percentage breakdown in the spending patterns of Japanese and Malaysian families - 2010 [2]
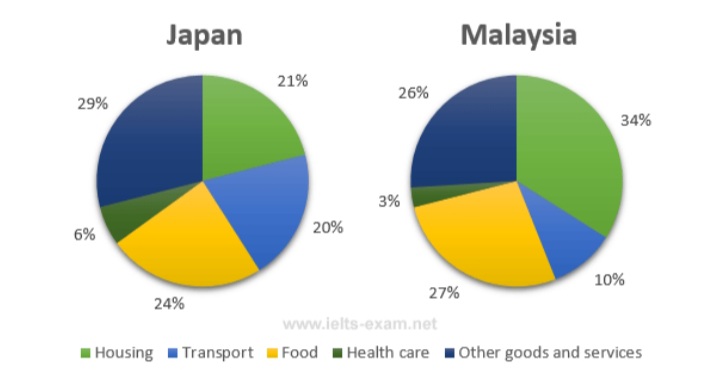
Writing: The pie charts below show the average household expenditures in Japan and Malaysia in the year 2010.
The two pie charts illustrate the percentage breakdown in the spending patterns of Japanese and Malaysian families in 2010.
Concerning Japan, a typical family spent the lowest amount of money on healthcare with an insignificant portion of 4%. Housing and transport, both accounted one- fifth of Japanese household expenditure, while the figure for food was slightly higher, at 24%. The largest proportion of money was allocated for other goods and services, at 29%.
When it comes to Malaysia, a similar pattern can be witnessed when a Malaysian household spared a tiny part of their budget for healthcare (3%), but substantial portions of more than a quarter for food and other goods and services. However, compared to Japan, the accommodation expense represented a much higher percentage (34%), meanwhile, the proportion for transport was much lower, only 10%.
Overall, both Malaysia and Japan spent significantly on food, housing and other goods and services in 2010. It is also noticed that the spending pattern of a Japanese family was more evenly split compared to a Malaysian one.
(174 words)
Comparing household expenditures in two countries
Writing: The pie charts below show the average household expenditures in Japan and Malaysia in the year 2010.
The two pie charts illustrate the percentage breakdown in the spending patterns of Japanese and Malaysian families in 2010.
Concerning Japan, a typical family spent the lowest amount of money on healthcare with an insignificant portion of 4%. Housing and transport, both accounted one- fifth of Japanese household expenditure, while the figure for food was slightly higher, at 24%. The largest proportion of money was allocated for other goods and services, at 29%.
When it comes to Malaysia, a similar pattern can be witnessed when a Malaysian household spared a tiny part of their budget for healthcare (3%), but substantial portions of more than a quarter for food and other goods and services. However, compared to Japan, the accommodation expense represented a much higher percentage (34%), meanwhile, the proportion for transport was much lower, only 10%.
Overall, both Malaysia and Japan spent significantly on food, housing and other goods and services in 2010. It is also noticed that the spending pattern of a Japanese family was more evenly split compared to a Malaysian one.
(174 words)

20200615_210324.jpg

