tuanhntta2020
Sep 6, 2020
Writing Feedback / WRITING TASK 1/ THE AMOUNT OF ELECTRICITY PRODUCED BY DIFFERENT ENERGY SOURCES TO SUPPLY NY CITY [3]
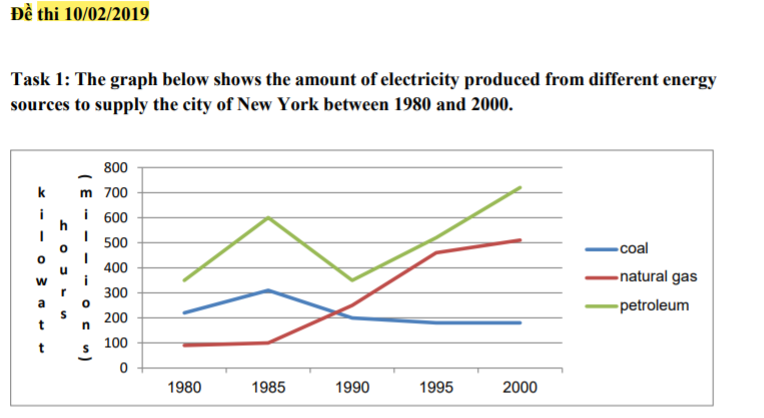
The given line chart illustrates the total quantity of electricity came from various types of energy sources, which was used to serve the needs of New York City during a twenty-year time from 1980 to 2000. It can be seen that while both the amount of eletricity produced by petroleum and natural gas experienced an upward trend, that generated by coal decreased slightly. More notably, the highest figure in the graph was more than 700 millions of kilowatt hours of electricity made by petroleum and the quantity of power developed by natural gas went through the most significant change.
From the starting point of the timeline, the amount of electricity formed by petroleum was approximately 350 millions hours, which was the largest figure. In another hand, that figure of coal was about 200 millions hours and the lowest figure went to natural gas of 100 millions hours.
After 20 years, the quantity of power developed by natural gas rocketed to more than 500 millions of hours, grew by 400 millions hours. The total hours of electricity profuced by petroleum also experienced a considerable rise to 700 millions, despite an dip from 600 millions to less than 400 millions in 1990. However, the hours of power generated by coal declined slightly to nearly 200 millions hours, after increased moderately to 300 millions hours in 1985.
energy from coal, natural gas and petroleum
The given line chart illustrates the total quantity of electricity came from various types of energy sources, which was used to serve the needs of New York City during a twenty-year time from 1980 to 2000. It can be seen that while both the amount of eletricity produced by petroleum and natural gas experienced an upward trend, that generated by coal decreased slightly. More notably, the highest figure in the graph was more than 700 millions of kilowatt hours of electricity made by petroleum and the quantity of power developed by natural gas went through the most significant change.
From the starting point of the timeline, the amount of electricity formed by petroleum was approximately 350 millions hours, which was the largest figure. In another hand, that figure of coal was about 200 millions hours and the lowest figure went to natural gas of 100 millions hours.
After 20 years, the quantity of power developed by natural gas rocketed to more than 500 millions of hours, grew by 400 millions hours. The total hours of electricity profuced by petroleum also experienced a considerable rise to 700 millions, despite an dip from 600 millions to less than 400 millions in 1990. However, the hours of power generated by coal declined slightly to nearly 200 millions hours, after increased moderately to 300 millions hours in 1985.

336109_1_o.png


