Unanswered [8] | Urgent [0]
  

Posts by papcaii
Name: Duy
Joined: Sep 18, 2021
Last Post: Oct 2, 2021
Threads: 4
Posts: 7  
Likes: 1
From: Viet Nam
School: Chu Van An Highschool

Displayed posts: 11
sort: Latest first   Oldest first  | 
papcaii   
Oct 2, 2021
Writing Feedback / [WRITING TASK 1] Southwest Airport redevelopment [2]

The plan below shows the site of an airport now and how it will look after redevelopment next year.
Summarise the information by selecting and reporting the main features, and make comparisons where relevant.


Given is the map illustrating some changes will occur in Southwest Airport in the near future.
Overall, two main modifications will be made to the airport. These involve the erections of new amenities and the modernization in the transportation system.
In the present there is only one door for each in the arrivals and the departures, but this number is likely to increase twofold in the following year. In the north of the airport, the boarding hall is going to be enlarged with the addition of 10 gates as well as being converted from a rectangular layout to an Y-shaped one. The walkway is also planned to be replaced by a sky train to optimize passenger's time to arrive at their gates.

The security and the customs remain unchanged, however, the check-in to the left of the departures will be replaced to the opposite site in order to make room for a bag drop and the relocation of the café. In addition, a new shop will be built next year, but only for the security area. There are also the constructions of an ATM, a cafe and a car hire which will be accompanied with a minor expansion in the southeast of the airport.

Thanks for your advice !


papcaii   
Oct 2, 2021
Writing Feedback / The number of men in senior development position in three companies (1980 to 2010) [3]

"man" is a singular noun while "men" is a plural one so you use that word, you can try the word "males" .
went uo approximately 1% i think this should be "went up BY/TO
strong rise you use some adjective like "exponential","considerable" which may increase your LR score
finally, i think you should use more connective word in your essay in order to improve its coherance, for example, "followed by","and then","before","after",....
papcaii   
Oct 2, 2021
Writing Feedback / Olympics participants writing bar chart [3]

i think you shoud have a more detailed overview, which may help the readers to easily understand what you are gonna write. In addition, you should separate your intro into two sentences for each type of chart since there are two different chart, as well as remember to mention its function.
papcaii   
Sep 23, 2021
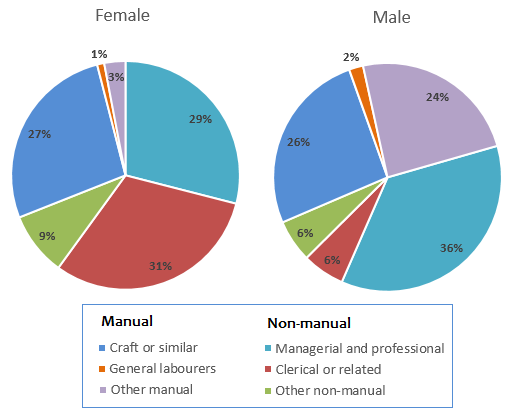
Writing Feedback / Given are the pie charts comparing two sexes in terms of the proportion of occupations in the UK [2]

Employment patterns in great britain in 1992


The two pie chart below show some employment patterns in great britain in 1992

Given are the pie charts comparing two sexes in terms of the proportion of occupations in the UK in the year 1992.
Overall, the majority of British women preferred non-manual jobs, while the figure for men was marginally fewer. It is also evident that clerical works were widely prevalent among the women, on the contrary, men were not interested in this form of jobs.

As can be seen in the graphs, the rate of managerial and professional employment was highest in both 2 genders, 29% for women and 36% for men respectively; conversely, that of general labourers works were relatively negligible in the studied year.

Regarding the percentage of clerical and related occupations in 1992, men overnumbered women in the ratio of 5 to 1 (nearly a third and 6%, respectively). In contrast, the opposite trend was true in the other manual jobs. Meanwhile, the proportions of craft among 2 sexes were the same, which stood at somewhere in the vicinity of a quarter.

Thanks for your help !


papcaii   
Sep 20, 2021
Writing Feedback / Information about the travelling tendency (cities visited) by people from the USA, Canada and Mexico [3]

PROMPT:

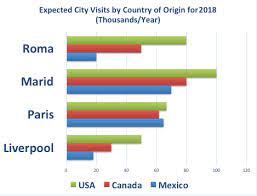
THE CHART SHOWS EXPECTED CITY VISITS BY COUNTRY OF ORIGIN FOR 2018 (THOUSAND/YEAR)


The given chart gives information about the travelling tendency to 4 countries of people in the USA, Canada and Mexico in the year 2018.
Overall, Marid is anticipated to be the most well-known tourist destination, on the contrary, the lowest figure belonged to Liverpool. It is also apparent that there will be a significant disparity in the number of travelers to the capital of France.

According to the current predictions, there will be numerous American visitors in Madrid(100 thousand), compared to the figure for Canadian and Mexican, with 80 thousand and nearly 70 thousand respectively. Similarly, the number of Americans having a trip to Liverpool is likely to stand at somewhere in the vicinity of 50 thousand, which is double and triple as much as the quantity of Canada and Mexico.

Looking at the graph more detail, the year 2008 is estimated to witness an equal number of citizens in these 3 countries travelling to Paris (above 600 thousand). Meanwhile, the figure for Rome is predicted to have the biggest difference among 3 nations, to be specific, there will be approximately 80 thousand American residents compared with just 50 thousand and 20 thousand visitors from Canada and Mexico respectively.

Thank you for your help!


papcaii   
Sep 20, 2021
Writing Feedback / The line graph illustrates the amount of people who bought music over seven years time frame [4]

i think a conclusion is unnecessary in WR task 1. instead of that you should write one more sentence in your overview, which will help readers imagine more easily what you're gonna indicate in the body. btw, u can try use "reached the record high of" since the word "peak" is pretty common, that may somehow increase your LR score, i think :))
papcaii   
Sep 18, 2021
Writing Feedback / The amount of money invested to study by the American government over a 28-year period [2]

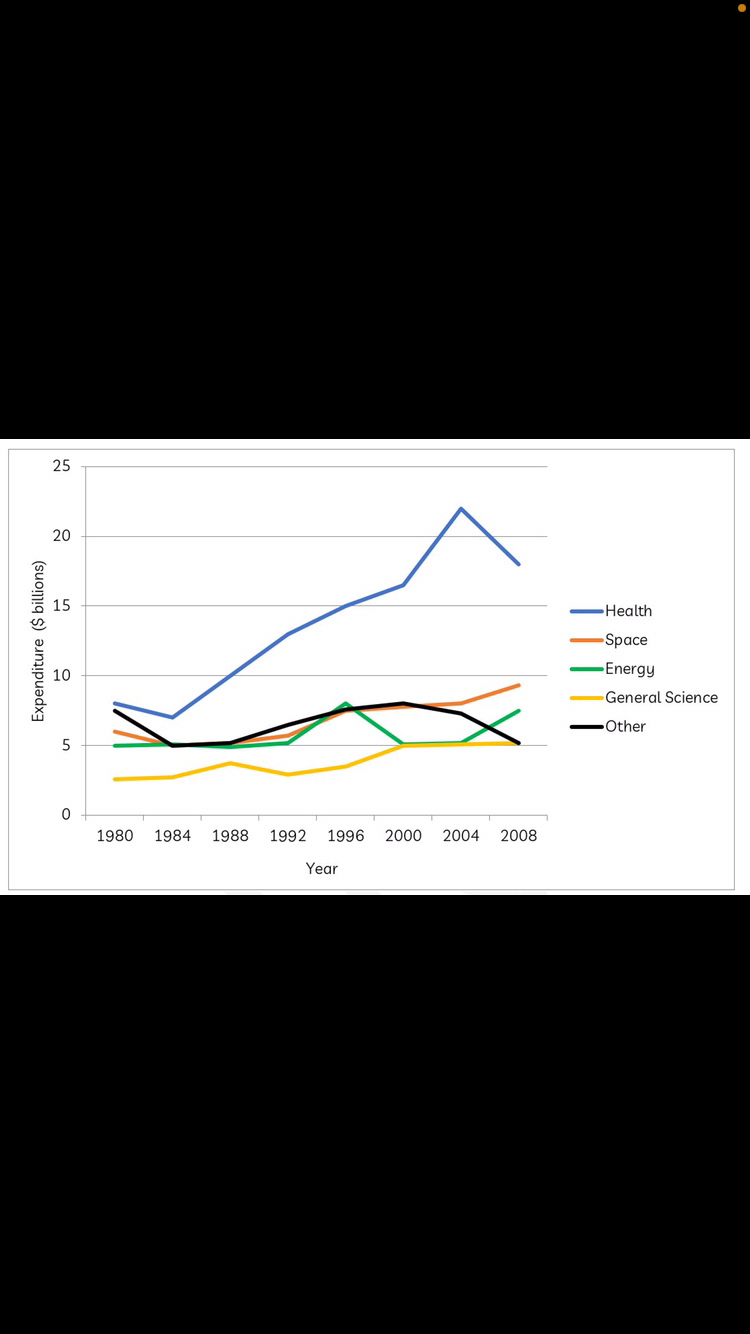
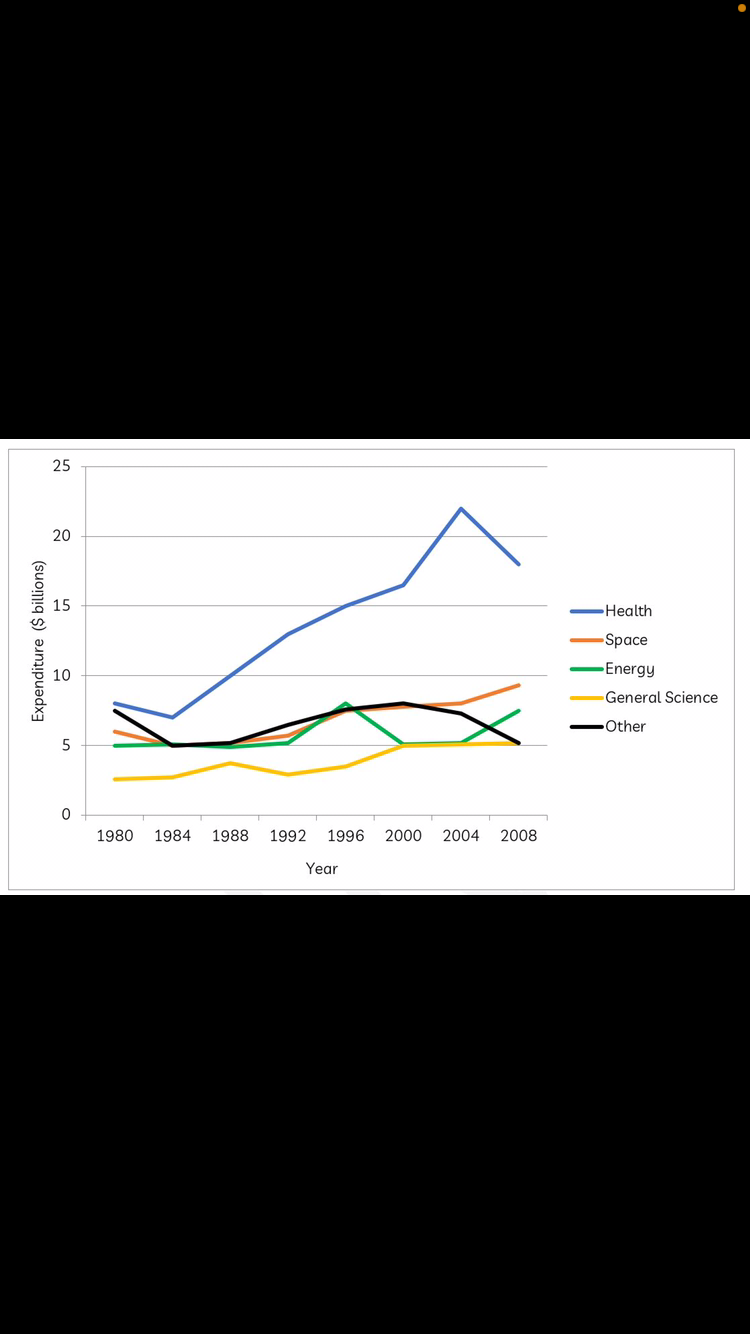
[WRITING TASK 1] U.S government expenditure


The graph below gives information about U.S. government spending on research between 1980 and 2008.

The given graph compares four fields in terms of the amount of money invested to study by the American government over a 28-year period. Overall, the expenditure for health, space and energy experienced an upward trend, while that for other researches fluctuated through the timeframe. It is also apparent that medical studies gained the most attention as well as several investments for the most of the period, on the contrary, developing new kinds of energy had a meager fund from the government.

In 1980, there was nearly 10 billion dollars spended in health research, compared with just approximately 7 billion dollars used in other studies. In the following years, the spending for health surged to above 20 billion dollars, reaching the record high in the year 2004, before witnessed a slight decline by nearly 4 billion dollars in the last 4 years. Meanwhile,there was a wavering in the figure for other fields, which ended up at somewhere in the vicinity of 7 billion dollars in 2008.

On the other hand, despite a marginal fluctuation, the expenditure for studying cosmos generally fell to just over 5 billion dollars in the first 12 years, whereas the amount of money spended for energy leveled off at about 3 billion dollars. And then, the figure for both these sectors shared the same upward trend to the last year of the period. However, the spending for space was still much more than that for energy in 2008( nearly 10 billion dollars and 6 billion dollars, respectively)


Writing
Editing Help?
Fill in one of the forms below to get professional help with your assignments:

Graduate Writing / Editing:
GraduateWriter form ◳

Best Essay Service:
CustomPapers form ◳

Excellence in Editing:
Rose Editing ◳

AI-Paper Rewriting:
Robot Rewrite ◳