Unanswered [1] | Urgent [0]
  

Posts by dangngoctung4
Name: Đặng Ngọc Tùng
Joined: Jul 1, 2023
Last Post: Jul 25, 2023
Threads: 4
Posts: 7  
From: Viet Nam

Displayed posts: 11
sort: Latest first   Oldest first  | 
dangngoctung4   
Jul 25, 2023
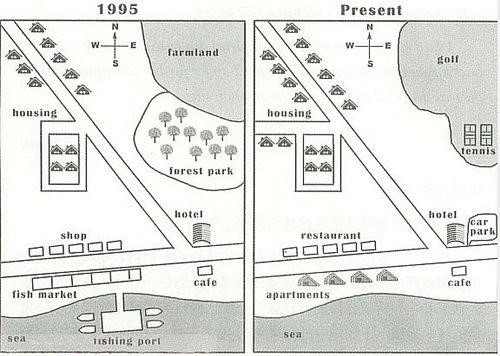
Writing Feedback / WT1: The map below shows the development of the village of Ryemouth between 1995 and present. [2]

The diagrams illustrate how the village of Ryemouth has changed since 1995.


Overall, the town has undergone a number of changes, the most important of which are the disappearance of green area, the increase of accommodations and the development of amenities catering for sports and food and drink demands.

The north-west of the town saw a number of changes, with the expansion of the housing area on both sides of the road and on the west side of the existing residential area, with a new pathway leading off the main road. The agricultural land in the north-east of the town was replaced by a golf course, along with the demolition of the forest park to be changed into two tennis courts.

In the south-west of the town, the chain of stores was converted into a restaurant complex, which was accompanied by the replacement of fish market with apartments on the opposite side of the road. To the south of the new apartment area, the fishing port has been removed. Finally, the hotel and cafe in the south-east of the town remained, with a new car park has been constructed for guests to settle their vehicles.


  • a.jpg
dangngoctung4   
Jul 24, 2023
Writing Feedback / Bar charts show the average size class in primary and secondary schools in 6 countries in 2006 [3]

It is better to report/compare with trends (increase - decrease), especially with this kind of chart (static chart, more than 5 categories).
In this case, in the 3rd paragraph, you are going to report the figure for South Korea, Japan, and Mexico and the remaining countries for the 4th paragraph because of their similarity in trends.
dangngoctung4   
Jul 8, 2023
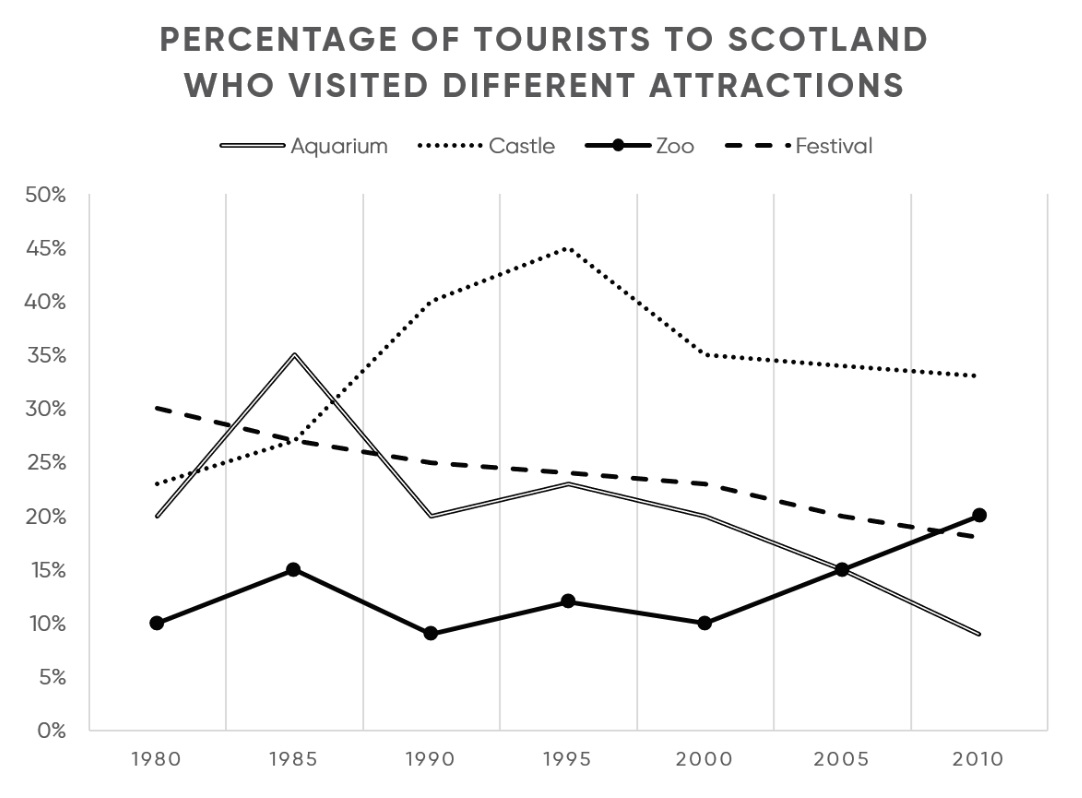
Writing Feedback / Writing Task 1: Line graph - The percentage of tourists to 4 attractions in Scotland for 30 years [2]

the popularity of four tourists attractions in Scotland


The graph illustrates the proportion of visitors in 4 points: aquarium, castle, zoo and festival in Scotland from 1980 to 2010.

Overall, it is obvious that the rate of those who visited the castle and zoo was more than the aquarium and festival over the period. Except the festival did not have too much change, all 3 remaining places were so for 30 years.

Starting at 10% in 1980, the zoo witnessed a fluctuation throughout the period, before ending at the highest point in the last year of the period which was 20%. Similarly, the castle began at 23% approximately in the first year, then thrived significantly for the next 15 years with a peak in 1995, at 45%, and finally experienced a considerable fall to nearly 35% in 2010.

In contrast, the aquarium's rate of visitors was one-fifth in 1980. The trend then climbed to the highest point at 35% in the next 5 years, followed by fluctuation until 1995, and fell gradually to 10% in 2010. Within 3 decades, however, the percentage of those who visited the festival nearly did not change but experienced a stable decrease from slightly over 30% in 1980 down to about one-fifth in the last year of the period.


  • bieudoduongco3d.jpg
dangngoctung4   
Jul 6, 2023
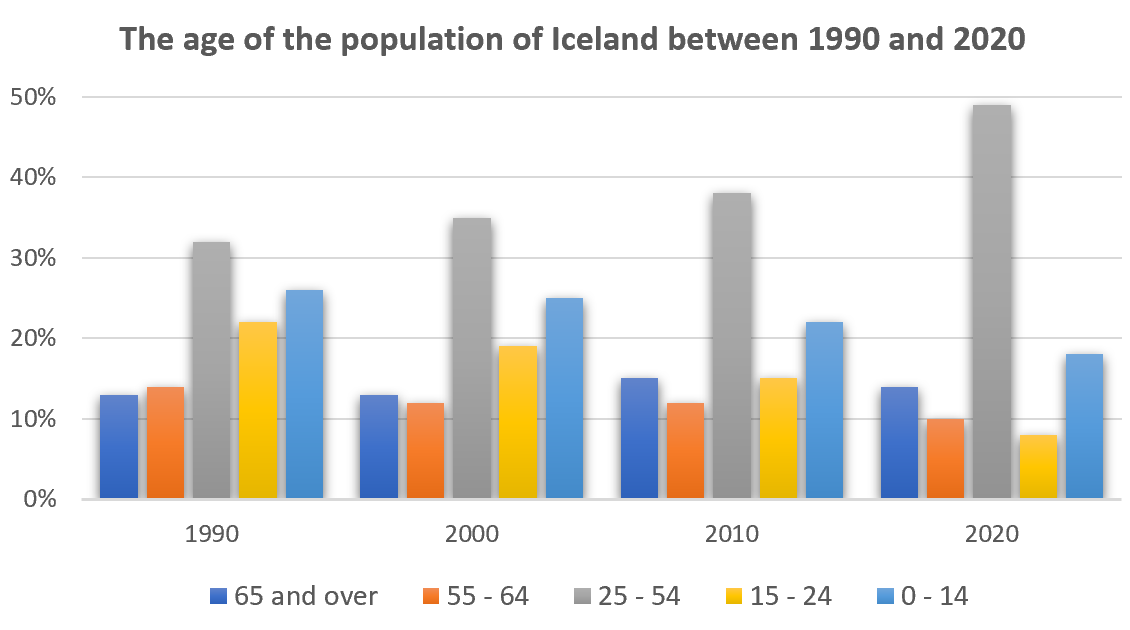
Writing Feedback / IELTS Writing Task 1: Bar graph - the population of Iceland between 1990 and 2020 [2]

The graph gives information about the age of the population of Iceland between 1990 and 2020.

The bar chart illustrates information about Iceland's population from 1990 to 2020.

Overall, it is obvious that the 25-to-54 age category increased and dominated for a decade, while the two younger groups experienced the opposite. The two older groups stayed nearly the same over the period.

In detail, the middle-aged was about 31% in 1990 and plummeted to nearly half of the population in the last year of the period.
In contrast, the youngest group started at about 26% in 1990, before falling gradually to slightly below 20% in 2020. The same trend can be seen in the adolescent group, which began about one-fifth in 1990 and approximately 8% in 2020 with the domination of the former group over the period.

The two older groups did not change too much throughout the decade. Those aged from 55 to 64 were about 14% in 1990, followed by a fluctuation in the next 20 years before possessing one-tenth of the population in the last year. Similarly, the oldest group with the commencement of about 12% in 1990 and 14% in the previous year of the period.

Thank you for your feedback!


  • s.png
dangngoctung4   
Jul 6, 2023
Writing Feedback / WRITING TASK 1: The seven stages of salmon's life cycle. [3]

Remember that in task 1, using pronouns is unpermitted because this is an analysis essay, not an opinion. Also, in my opinion, it is better to use the sentence "The cycle is then repeated/repeated itself" lastly in the last paragraph, which is the last one in the first paragraph but used inappropriately (because of the pronoun error).
dangngoctung4   
Jul 6, 2023
Writing Feedback / IELTS Task 1 - The diagram illustrates changes of Stokeford during the 80-year period [5]

There are several minor details in the last paragraph that I would like to contribute to make it more clear.

In the eastern, on the opposite site side of the new U-shape road, there was a land conversion from the garden and large house to the retirement home, with a small new road and a couple of houses connected to the main road. Sandwiched between these residential areas, the post office was remained remain unchanged; across the road, the primary school was spread (in my opinion it is better to use expanded) eastward.
dangngoctung4   
Jul 1, 2023
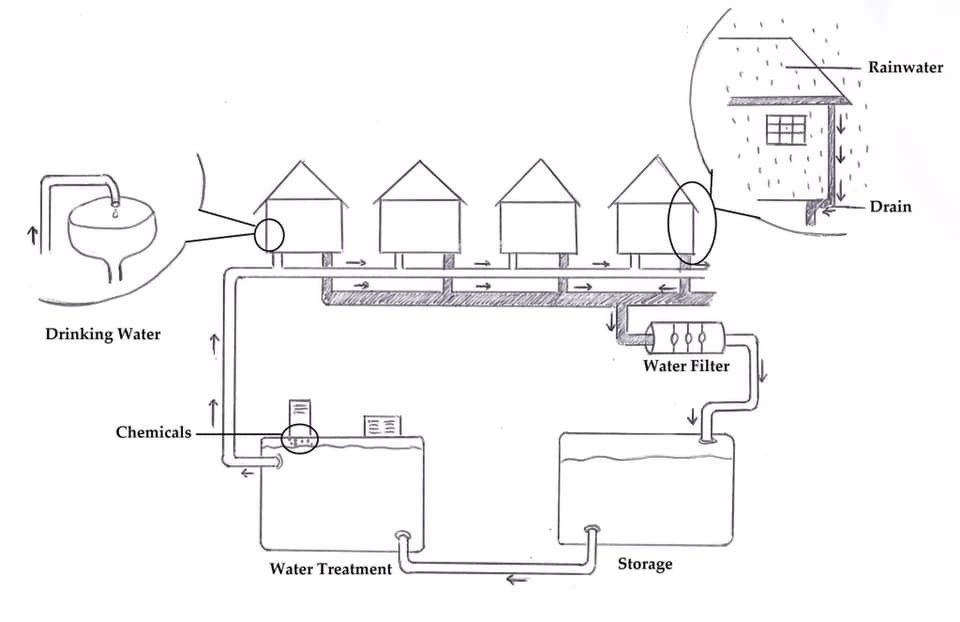
Writing Feedback / IELTS Academic Writing Task 1 - Diagram Process - rainwater collection and further treatment [3]

The diagram below shows how rainwater is collected and then treated to be used as drinking water in an Australian town.

Summarise the information by selecting and reporting the main features and make comparisons where relevant.


The provided picture illustrates the way of rainwater is collected and processed into drinking water in an Australian town.
Overall, the process begins with rainwater being collected from the roof, throughout several stages with separated functions, then ends with the return back to households as drinking water and ready to use.

Firstly, when the rain comes, the rainwater pours from the roofs of households down to the drain, which is connected to a system of pipes underground. After that, the current experiences a filter stage in a water filter, in order to sort out the dust and wastes, then flows into a rectangular container.

Subsequently, the filtered water undergoes the pasteurization stage with a tank combined with chemicals to clear out the water. Finally, the clean water is pumped back to households via the pipe system and is ready to use. The cycle is then repeated when it is rain.

Thank you for your feedback!


  • cc.jpg
Do You Need
Academic Writing
or Editing Help?
Fill out one of these forms:

Graduate Writing / Editing:
GraduateWriter form ◳

Best Essay Service:
CustomPapers form ◳

Excellence in Editing:
Rose Editing ◳

AI-Paper Rewriting:
Robot Rewrite ◳

Academic AI Writer:
Custom AI Writer ◳