Titus14
Jul 6, 2016
Writing Feedback / The causes of less productive agricultural land degradation during the 1990s in 3 continents [2]
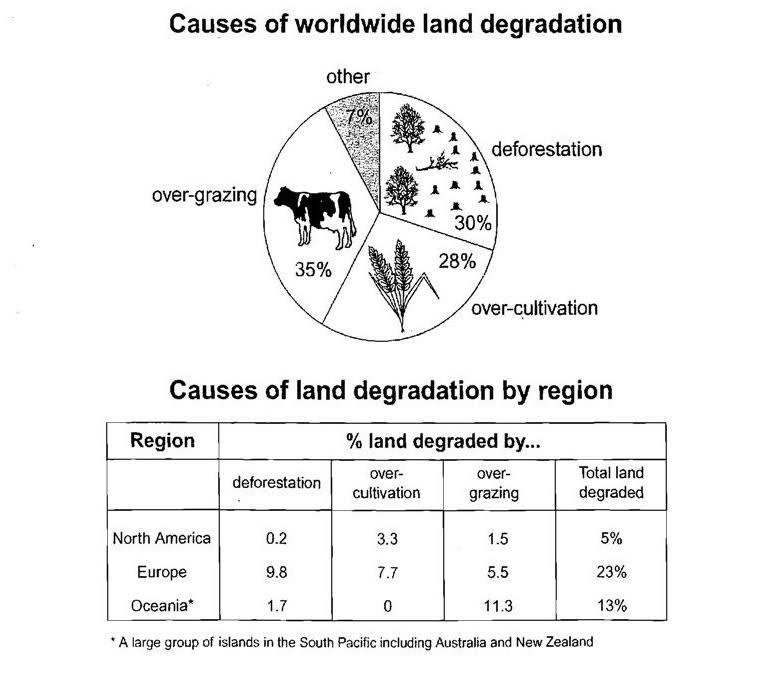
The pie chart below shows the main reasons why agricultural land becomes less productive. The table shows how these causes affected three regions of the world during the 1990s.
Summarize the in formation by selecting and reporting the main features, and make comparisons where relevant.
The pie chart provides information about the causes of less productive agricultural land degradation during the 1990s in three different continents: North America, Europe and Oceania, which not only included south pacific islands, but also Australia and New Zealand.
It is clear that over-grazing was the main reason to land degradation in the late 20th century. In addition, the majority percentage of land degradation was caused by European countries.
According to the pie chart, 28% of land degradation was a result of over-cultivation. However, Oceania remained 0% during the last decade of 20th century. On the other hand, the percentage of over-grazing in Oceania was the highest comparing with the other regions.
Although the major reason of land degradation was caused by over-grazing, North America did not participate much in it, at the rate of only 1.5%, which was the lowest among the others. In fact, merely 5 % of land were degraded by North America.
(156words)

145496_1_o.jpg


