Unanswered [7] | Urgent [0]
  

Posts by Febri91
Name: Febri Fransiska
Joined: Jan 18, 2016
Last Post: Jan 26, 2016
Threads: 5
Posts: 6  
From: Indonesia
School: Sriwijaya University

Displayed posts: 11
sort: Oldest first   Latest first  | 
Febri91   
Jan 18, 2016
Writing Feedback / The Rate of Boy and Girl Students Passing The Exam Based on Subject of Study [2]

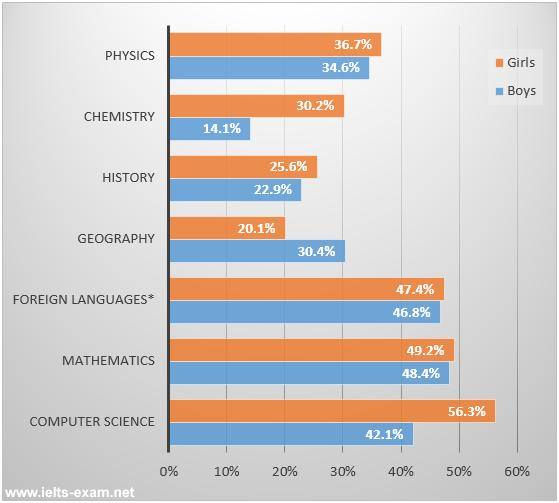
The bar chart below shows the percentage of students who passed their high school competency exams, by subject and gender, during the period 2010-2011.

The bar chart compares the percentage of boy and girl students passing the exams based on subject of studies from 2011 to 2011. At first glance, science studies have a larger successful student in the exams than social studies, while girl students are most dominant than boy students in every subject of studies except geography.

Regarding to science studies, computer science, mathematic, chemistry, and physic, the most girl students are success in computer science exam, at 56.3%, compared to 42.1%, boy students. The rate of Girl students is also larger than boy rate in other science examinations. For Mathematics and physic examinations, girl students are far less than boy students, while in chemistry examination, girl students have twice larger than boy students.

Turning to social studies which are history, geography, and foreign languages, the most subject that boy students are more successful than girl students is geography, at less than a third compared to more than a fifth, while in the other social examinations, girl students are still more dominant, despite just a very small number.


  • The_bar_chart_below_.jpg
Febri91   
Jan 19, 2016
Writing Feedback / The number of students interested in lesson [5]

Hello Desy, let me correct your writing.

The bar chart gives information about the statistic of ladies and gentlemen in different (...) in secondary schoolmale and female who are success in proficiency assessment in secondary school categorized by different lesson over a 12-month period and is measured in percent for every lesson .

... examination was higher than that of boys. Interestingly, geography was the singleonly lesson having the percentage of gentlemen was more than ladies . that male students were higher than female students

First of all, the most interesting in subject was computer science by girls.
... a half percent of students, was illustrated by girls in mathematics ...
... chemistry was the smallest statistic fromof all the lesson, the total rate of boys forwas far less of the statistic than that ofwomengirls .
Febri91   
Jan 19, 2016
Writing Feedback / The Proportion of The World's Spending, Population, and Consumption of Resources [2]

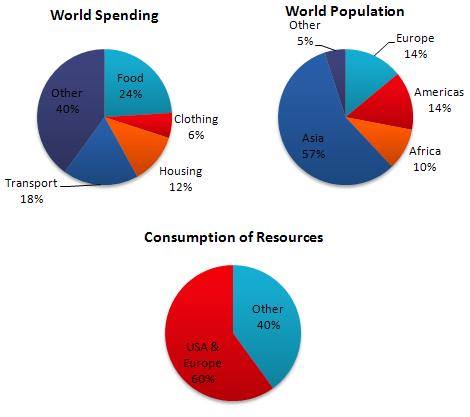
The pie charts below show World Spending, World population and Consumption of Resources

The pie chart gives information about the proportion of the world's spending, population, and consumption of resources. Overall, USA and Europe have a less population than Asia, but for the utilization of raw materials, those use the most of the sources. It is also important to note that the significant proportion for the world's spending is expending on food.

Following this chart, most of the world's resources is consumed by three-fifths American and European, while two-fifths of the rest is consumed by other countries. On the contrary, inhabitants in America and Europe are just under a quarter. This is smaller than Asia which has nearly three-fifths inhabitants of the world, while Africa and other countries have minority populations.

Turning to the world's expending, there are five kinds that people commonly spend the wealth. The large proportion, nearly a quarter people expend money on food, whilst the very small number of people spends on collecting clothes. People also expend more money on housing and transport which have less than a third of proportion, and two-fifths society use for other needs.


  • Task_1Pie_Chart.jpg
Febri91   
Jan 19, 2016
Writing Feedback / A comparison of residents rate in three different areas of Oregon from 1940 to 2000 - the line chart [4]

A breakdown of population rate in three ...

A breakdown of population rate in three counties during sixty-year period is shown in the line chart. Overall, the population rate in three counties experienced a significant increase. However, Washington had a larger rose than two other counties.

Initially, the number of population rose significantly overduring the 60 years and reached ...

At more detailed look atanalysis, the graph revealsrevealed that the difference was less marked ...

Additionally, for the next 30 years,1970 experienced slightlya slight increase in the number of ...

Febri91   
Jan 20, 2016
Writing Feedback / The Rate of U.S. Consumption of Energy Since 1980 with Projection until 2030 [2]

Annual Energy Outlook report


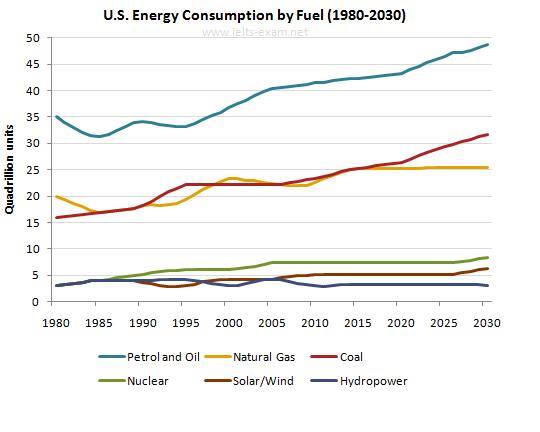
The graph below gives information from Annual Energy Outlook 2008 about consumption of energy in the USA since 1980 with projection until 2030

The line graph of Annual Energy Outlook 2008 shows the rate of U.S. consumption of energy since 1980 with projection until 2030. Overall, there was a gradual increase in three energy sources either in historical trend or in projection, while three other sources remained stable in the year projection. However, Petrol and Oil still remained as the chief source for the US.

To begin, in 1980, energy from Petrol and Oil was the largest number of US energy consumption, which stood at 35 quadrillion, while the second largest was Solar and Natural Gas, at 15 and 20 quadrillion. The least number of consumption in the beginning of period was Nuclear, Hydropower, and Coal. Following the historical years of the period (1980-2015), each of energies experienced a small fluctuation.

Next, in the projecting years of the period (2015-2030), there is a different trend. Petrol and Oil energy, Natural gas, and Solar/Wind energy are projected to rise sharply after 2015, whilst Petrol and Oil energy are still expected as the largest energy consumed by the U.S. Meanwhile, three other energies, Nuclear, Hydro power, and Coal, are expected to remain constant until the last of period.


  • The_graph_below_give.jpg
Febri91   
Jan 21, 2016
Writing Feedback / IELTS TASK 1 - THE COMPARISON OF INTERNAL AND EXTERNAL COMMUNICATION ABILITIES [3]

Hi awe_28

Here is my suggestion for introduction

A comparison of the figure for surveys about the essential skills in communication for job in two different years, 1997 and 2006 is provided in the table. Overall, there were two kinds of communication skills, internal and external. In both of the years, the result showed that the essential skill in job was the external communication.
Febri91   
Jan 21, 2016
Writing Feedback / Proportion of World Expense, Amount of The world Population and Utilisation of Sources [3]

Hi, Yus72

Here is my suggestion for your introduction

A comparison of the proportion of the world's expenses and consumption compared with the percentage of worldwide inhabitants is illustrated in the bar charts. At first glance, the proportion of people in Asia is more dominant than others. However, USA and Europe consume more resources than other countries.
Febri91   
Jan 21, 2016
Writing Feedback / A Comparison of Household Expenditures between 1950 and 2010 - the pie charts [2]

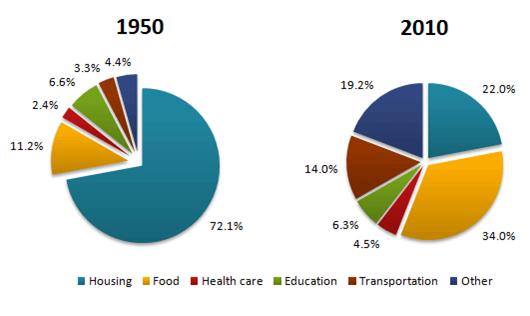
The pie charts below show the average household expenditures in a country in 1950 and 2010

A comparison of the proportion of domestic spending in a country in two different years, 1950 and 2010 is illustrated in the pie chart. Overall, there was a different trend in two years of the period. The percentage of the food expenditure experienced a significant increase, while the housing expenditure decreased sharply from 1950 to 2010.

In 1950, the household expenses were dominated by spending on housing, less than three-quarters of all household expenditures. However, in sixty years later, housing expenditure decreased dramatically to more than a fifth of the total. In contras, food expenditure in 1950 was at more than one in ten, then in 2010, increased significantly to more than a third of the total. It was followed by other expenses which also increased dramatically, from 4.4% to 19.2%.

Three other expenditures, health care, education and transportation, saw a less change. Those expenditures still remained stable at around less than a fifth, Education expenses from 6.6% to 6.3%, Health care expenditure from 2.4% to 4.5%, and Transportation spending from 3.3% to 14.0%.


  • The_pie_charts_below.jpg
Febri91   
Jan 21, 2016
Writing Feedback / IELTS 2: Some people believe that to effort the healthy lifestyle in advanced era is extremely hard [3]

Hi, Pertiwi02

Here is my correction for your writing

The health issue is one of debatable topicS in the community these daysNOWADAYS . Some people believe that to effort the healthy lifestyleTHE EFFORT TO OBTAIN HEALTHY LIFE in advanced era is extremely ...

This is because most people isARE very busy almost every ...

However, I do not believe that these arguments are completely true.
... are many kinds of sport THAT can be done every time and everywhere. Taking the jogging as anFOR example, this sport is very ...
Febri91   
Jan 26, 2016
Writing Feedback / Two Ways to Fill The Irrigation Channel-The Diagrams [2]

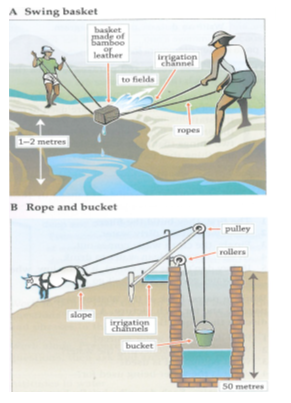
The diagrams below show two methods of collecting water for irrigation purposes

The diagrams present two ways to fill the irrigation channel. At first glance, the methods of filling irrigation channel depend on the depth of the water source. However, the rope-bucket method is more effective than the method of swing basket.

With regards to the rope-bucket method, it can be applied in down hill in which the depth of water source is about 50 meters. The tools for applying this method consist of bucket, rollers, ox, and pulley. The process to fill the irrigation channel is begun with filling the water to bucket that is then pulled by ox. Helped by rollers and pulley, the water is poured from the bucket into the irrigation channel automatically.

Turning to the swing-basket method, it is usually applied in the hill in which the depth of water source is about 1-2 meters. This method is simple. It just needs basket made of bamboo or leather as the main tool and ropes to swing the basket. The process of this method is begun with filling the water to the basket that is then swung by two men to the irrigation channels.


  • Task_1Diagrams_of_t.png
Need Writing or Editing Help?
Fill out one of these forms:

Graduate Writing / Editing:
GraduateWriter form ◳

Best Essay Service:
CustomPapers form ◳

Excellence in Editing:
Rose Editing ◳

AI-Paper Rewriting:
Robot Rewrite ◳

Academic AI Writer:
Custom AI Writer ◳