Thao4real
Nov 18, 2022
Writing Feedback / The pie charts below show units of electricity production from fuel sources in Australia and France [2]
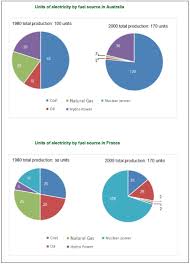
The pie charts delineate the figures for electricity production from fuel sources in Australia and France, between 1980 and 2000.
In short, coal took the lead for the electricity product in Australia while nuclear power was the main source in France. The amount of electricity by different fuel sources was not similar in both countries.
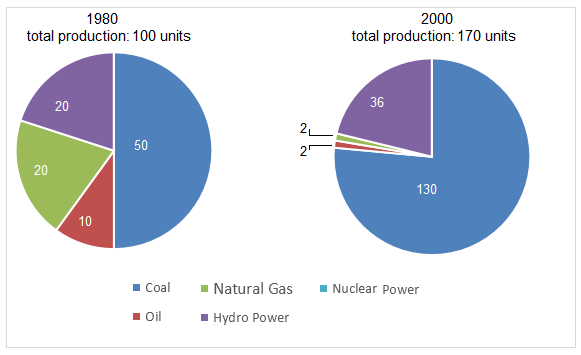
According to the given pie charts, in Australia, the total electricity production was only 100 units; however, it doubled in the year 2000.There were 50 units and 20 units of electricity produced by coal and hydro power, respectively in 1980. Besides, the oil contributed to only 10 units of electricity. Then, the year 2000 witnessed a considerable increase in the usage of coal which accounted for 130 out of 170 units.
Furthermore, it was shown that electricity production in France was apparent. At the beginning of the period, the dependency on coal denoted as 25 units, followed by a sharp decrease in 2000. In contrast, nuclear power became the primary source, holding 126 units.
electricity from different fuel sources
The pie charts delineate the figures for electricity production from fuel sources in Australia and France, between 1980 and 2000.
In short, coal took the lead for the electricity product in Australia while nuclear power was the main source in France. The amount of electricity by different fuel sources was not similar in both countries.
According to the given pie charts, in Australia, the total electricity production was only 100 units; however, it doubled in the year 2000.There were 50 units and 20 units of electricity produced by coal and hydro power, respectively in 1980. Besides, the oil contributed to only 10 units of electricity. Then, the year 2000 witnessed a considerable increase in the usage of coal which accounted for 130 out of 170 units.
Furthermore, it was shown that electricity production in France was apparent. At the beginning of the period, the dependency on coal denoted as 25 units, followed by a sharp decrease in 2000. In contrast, nuclear power became the primary source, holding 126 units.

tixung.jpeg
Australia
