yucky
Sep 19, 2013
Writing Feedback / Ielts line graph-percentage of population aged 65 and over [5]
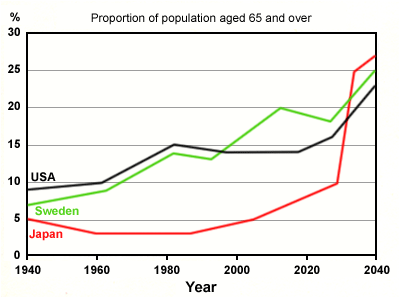
The graph below shows the proportion of the population aged 65 and over between 1940 and 2040 in three different countries.
Summarise the information by selecting and reporting the main features and make comparisons where relevant. (Cambridge ielts 5, page 29)
The line chart describes the percentage of elderly people whose age is 65 and over in Japan , Sweden and the USA . Overall, the figure indicates an upward trend in all three mentioned countried.
The USA started at just below 10%, which is the highest porportion in comparison to that of Sweden and Japan, 7% and 5%, respectively. The percentage of the old in the USA first witnessed a rapid increase to precisely 15% in 1980. Following a similar patern , the Sweden figure rose to just under 15%. There is then a low period of stabilazition in the porportion of population aged 65 and over in The USA, not until the year 2020 is it predicted to rise dramatically and hit a peak of below 25%, though it is the lowest one compared to the others. On the contrary, the percentage in Sweden fluctuated with an upward trend , overtook that of the USA in 1999 with just under 15%, after that, it is anticipated to rocket to a quarter in 2040. At the other end of the scale, Japan's porportion of the elder remained the lowest in the first 70 years of the period, but then is expected to suddenlly rocket to 27% in 2040, which makes Japan become the country with largerst percentage of people aged 65 and over in 3 countries

sampleieltstask1.gif

