Goldengoat
Aug 23, 2021
Writing Feedback / The profits of the top five mentioned mobile phone brands made through selling their products [2]
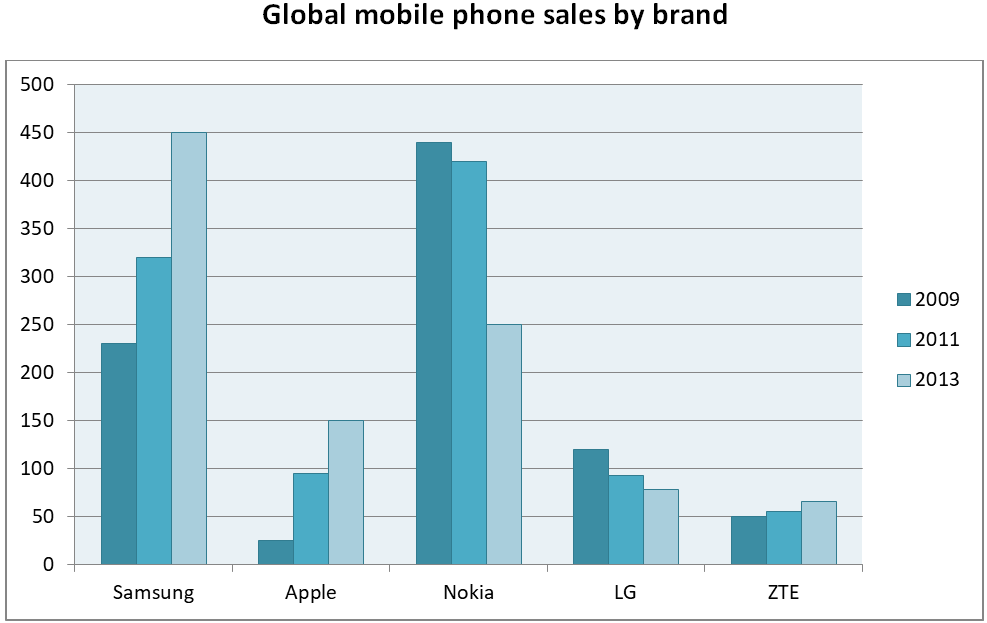
The profits the top 5 mentioned mobile phone brands made through selling their products in a period of 4 years, starting from 2009 are vividly depicted in the bar chart provided.
From the chart, it is obviously evident that the sales of Samsung and Nokia took turn to top the chart. What's more, the sales figure of Samsung, Apple and ZTE experienced an upward trend during the period while that of Nokia and LG tended to go down gradually.
In 2009, Nokia brand took the lead in the sales with nearly 450 while those of Apple is the lowest only about 20. Nokia continued to possess the highest sales figure in 2011. At the same time, Samsung was second to Nokia in sales. The sales of Apple, LG and ZTE in that same year were 98,97 and 51 respectively. The sales number of Samsung in 2013 was 450, which made it the brand that had the highest sales in that year compared to the 4 other brands in the chart. Nokia came second with 250. The third place belonged to Apple with 150, the forth and fifth place to LG and ZTE in the order mentioned.
I have a question. How can I write a better description of the chart's main features? All I write was the highest and the lowest figures and then I list the rest.
Thank you very much for your feedback and your help <3
Ielts writing test 1: mobile phone brands global sales
The profits the top 5 mentioned mobile phone brands made through selling their products in a period of 4 years, starting from 2009 are vividly depicted in the bar chart provided.
From the chart, it is obviously evident that the sales of Samsung and Nokia took turn to top the chart. What's more, the sales figure of Samsung, Apple and ZTE experienced an upward trend during the period while that of Nokia and LG tended to go down gradually.
In 2009, Nokia brand took the lead in the sales with nearly 450 while those of Apple is the lowest only about 20. Nokia continued to possess the highest sales figure in 2011. At the same time, Samsung was second to Nokia in sales. The sales of Apple, LG and ZTE in that same year were 98,97 and 51 respectively. The sales number of Samsung in 2013 was 450, which made it the brand that had the highest sales in that year compared to the 4 other brands in the chart. Nokia came second with 250. The third place belonged to Apple with 150, the forth and fifth place to LG and ZTE in the order mentioned.
I have a question. How can I write a better description of the chart's main features? All I write was the highest and the lowest figures and then I list the rest.
Thank you very much for your feedback and your help <3

654574EE7F9E430DB.png

