rishabhk4896
Feb 22, 2023
Writing Feedback / IELTS Task 1 The chart below shows the percentage of people accessing news via different media [2]
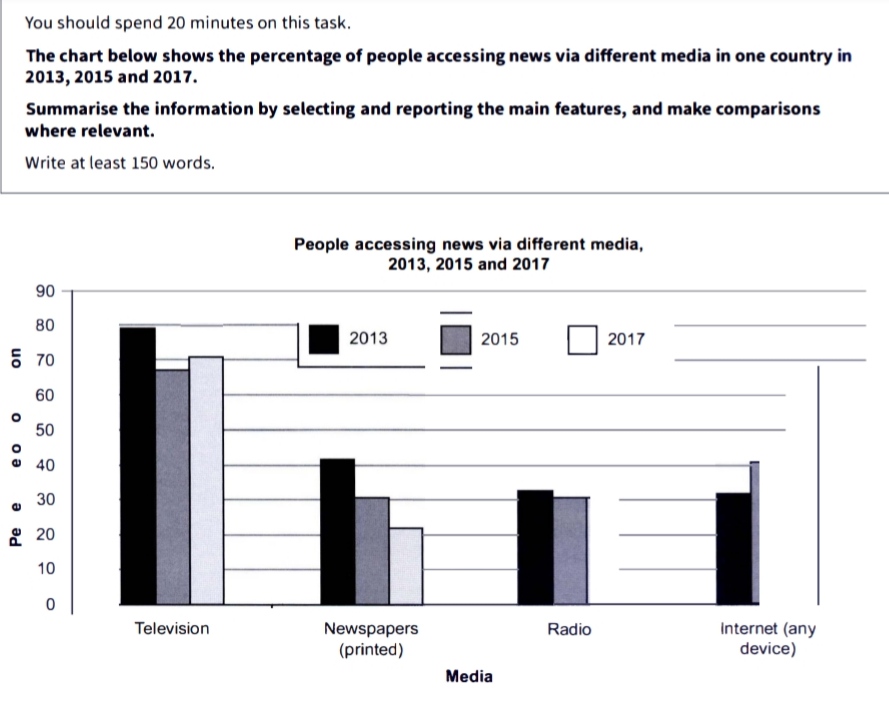
The chart below shows the percentage of people accessing news via different media in one country in 2013, 2015 and 2017.
The chart depicts the proportion of people receiving news via various broadcasting channels in a country for 2013, 2015 and 2017. In general, people accessing information through radio and the Internet increased considerably, while television and printed media faced a noticable drop in their veiwers during the period given.
The percentage of people getting news on internet and radio was almost the same in the year 2013, at about 32%. In the case of radio, a small decline of audience in 2015 was noticed, but eventually it witnessed an upward trend in 2017, concluding at around 36%. Internet news readers, however, rose nearly 8% in 2015, and the same reached to just under 70% in 2017.
Television and Newspaper were approximately four-fifths (80%) and two-fifths (42%) of the number of total people in 2013. There was a constant fall in the proportion of newspaper readers, as it fell down to 30% in 2015 and it further dropped to 22% in 2017. Television viewers decreased by roughly 15% in 2015, whereas a growth of 5% was visible in 2017. Television audience ended as same as of internet in 2017 (70%).
The chart below shows the percentage of people accessing news via different media in one country in 2013, 2015 and 2017.
Summarise the information by selecting and reporting the main features, and make comparisons where relevant
The chart depicts the proportion of people receiving news via various broadcasting channels in a country for 2013, 2015 and 2017. In general, people accessing information through radio and the Internet increased considerably, while television and printed media faced a noticable drop in their veiwers during the period given.
The percentage of people getting news on internet and radio was almost the same in the year 2013, at about 32%. In the case of radio, a small decline of audience in 2015 was noticed, but eventually it witnessed an upward trend in 2017, concluding at around 36%. Internet news readers, however, rose nearly 8% in 2015, and the same reached to just under 70% in 2017.
Television and Newspaper were approximately four-fifths (80%) and two-fifths (42%) of the number of total people in 2013. There was a constant fall in the proportion of newspaper readers, as it fell down to 30% in 2015 and it further dropped to 22% in 2017. Television viewers decreased by roughly 15% in 2015, whereas a growth of 5% was visible in 2017. Television audience ended as same as of internet in 2017 (70%).

IMG_20230222_134325..jpg


