DanielDang
Nov 19, 2022
Writing Feedback / The nitrogen oxide produced by 4 types of transports [2]
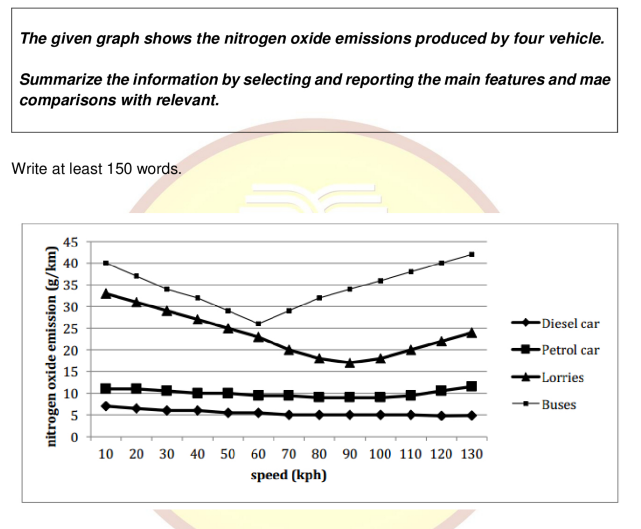
The given line chart provided comparison of the amount of nitrogen oxide released by diesel car, petrol car, lorries and buses. From an overall perspective, it is evident that buses and lorries are more pollutant than two remained cars. While diesel car and petrol car dispose the same amount of emission as the speed increase, the figure for buses and lorries fluctuate mildly.
At the slowest level of pace, buses account for the highest amount of nitrogen oxide gas produced, at precisely 40 gam per kilometer. By contrast, lorries release nearly 33 gam per kilometer, which is slightly lower than buses but still much higher than other vehicles. The figure for diesel car and petrol car stands at approximately 7 g/k and 12g/k, respectively.
With the speed increases from 10 to 130 kph, the nitrogen oxide waste of buses experiences an oscillation, with the amount of emission decreases to 22 g/k at 60 kph before goes up to 45 g/k at the maximum speed. Similarly, lorries saw a steadily fall in the emission when the speed increase to 90 kph, but bucks the trend with 7 g/k rise at 130 kmh. While the amount of diesel car emission slightly fell by 2 g/k at the fastest pace, the figure for petrol car witnesses a small increase to 13 g/k
nitrogen oxide emission
The given line chart provided comparison of the amount of nitrogen oxide released by diesel car, petrol car, lorries and buses. From an overall perspective, it is evident that buses and lorries are more pollutant than two remained cars. While diesel car and petrol car dispose the same amount of emission as the speed increase, the figure for buses and lorries fluctuate mildly.
At the slowest level of pace, buses account for the highest amount of nitrogen oxide gas produced, at precisely 40 gam per kilometer. By contrast, lorries release nearly 33 gam per kilometer, which is slightly lower than buses but still much higher than other vehicles. The figure for diesel car and petrol car stands at approximately 7 g/k and 12g/k, respectively.
With the speed increases from 10 to 130 kph, the nitrogen oxide waste of buses experiences an oscillation, with the amount of emission decreases to 22 g/k at 60 kph before goes up to 45 g/k at the maximum speed. Similarly, lorries saw a steadily fall in the emission when the speed increase to 90 kph, but bucks the trend with 7 g/k rise at 130 kmh. While the amount of diesel car emission slightly fell by 2 g/k at the fastest pace, the figure for petrol car witnesses a small increase to 13 g/k
Picture1.png
