Unanswered [13] | Urgent [0]
  

Posts by christyj
Joined: Feb 23, 2013
Last Post: Mar 6, 2013
Threads: 5
Posts: 15  

From: India

Displayed posts: 20
sort: Latest first   Oldest first  | 
christyj   
Mar 4, 2013
Writing Feedback / (ielts graph) Different modes of transport in one of the European city [2]

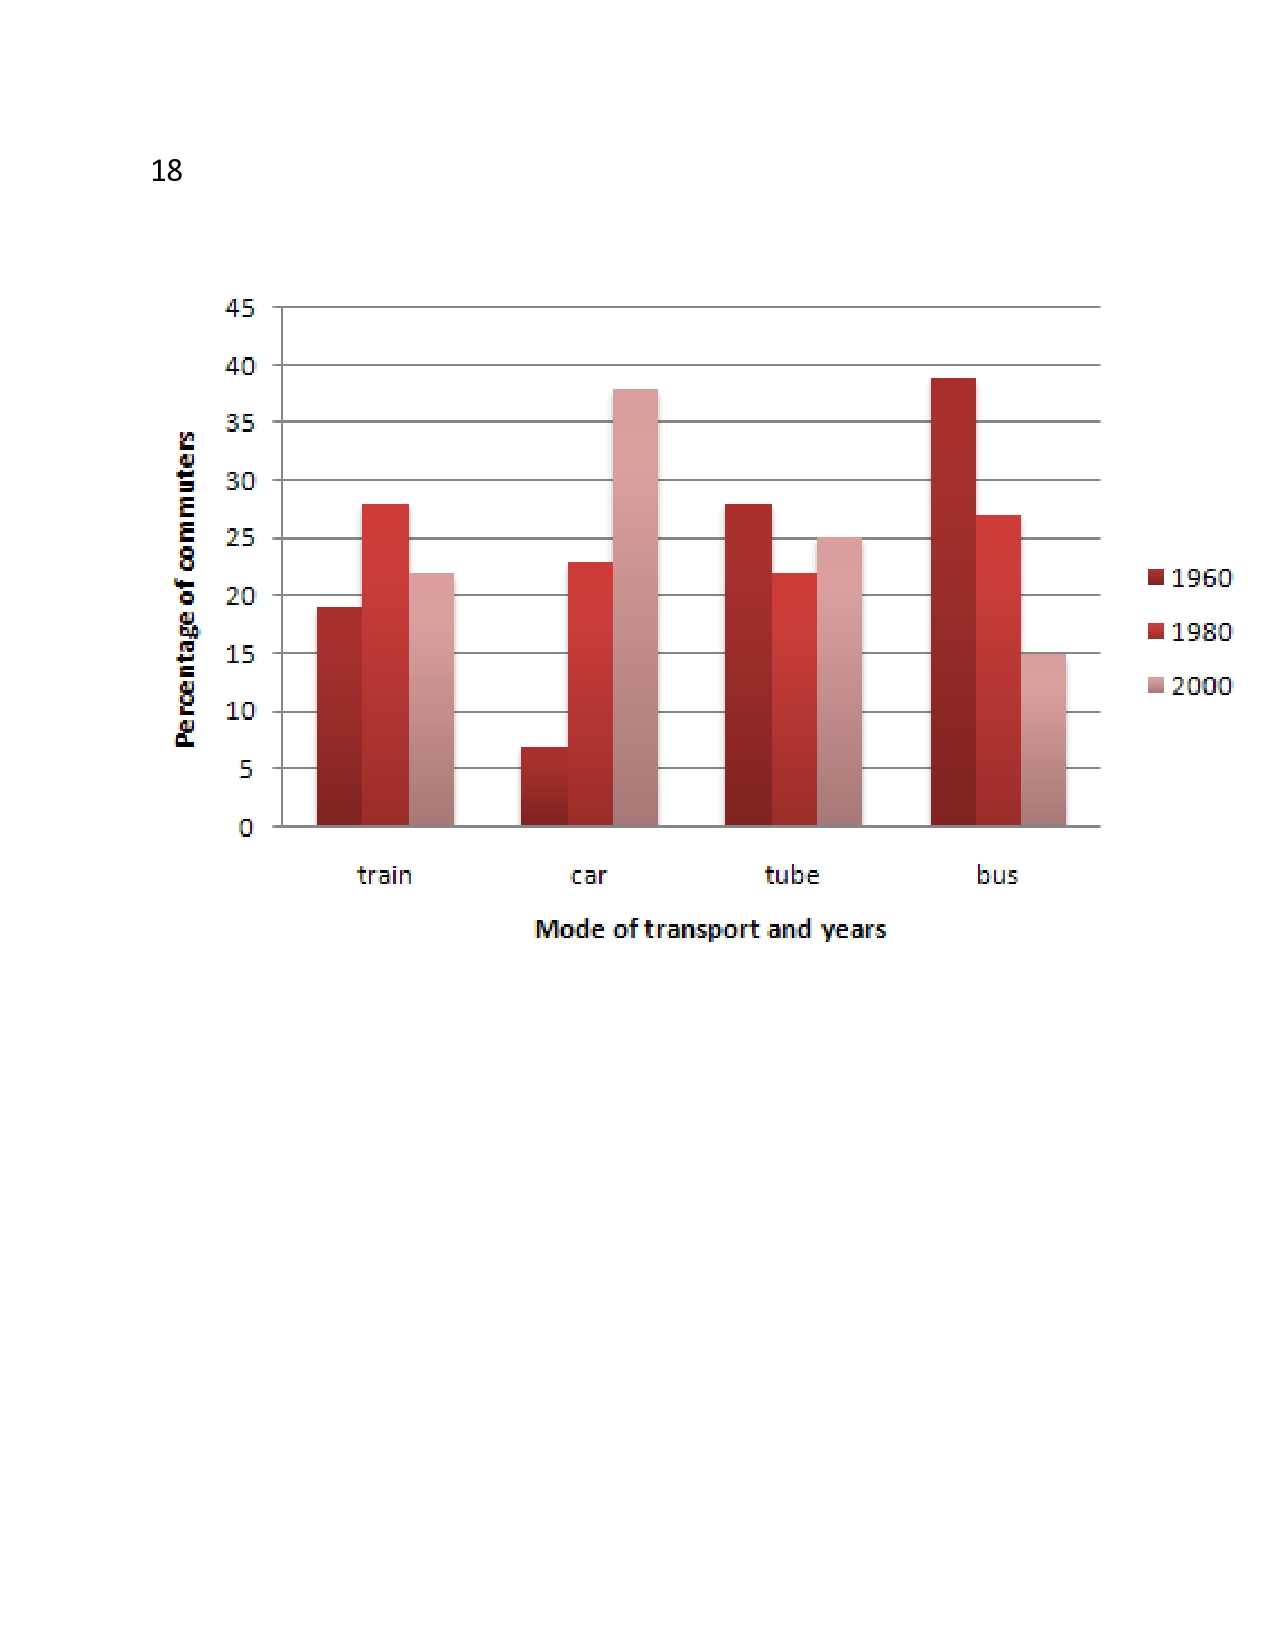
The graph below shows the different modes of transport used to travel to and from work in one European city in 1960, 1980 and 2000.

Write a report for a university lecturer describing the information below.
- You should write at least 150 words.
- You should spend about 20 minutes on this task.

The given graph gives details about the mode of transport in the years of 1960, 1980 and 2000 in one of the European cities. The modes of transports under review are namely train, car, tube and bus.

Overall, the popularity of bus transport for commuting in the year 1960 was taken over by cars in the year 2000. In the year 1960 the popular mode of transport was bus, 38%, that was two times higher than that of the car use. The year 1980, tube and car became equally popular with 23% of commuters. The difference between the train and bus are minimal around 28%.

After forty years from 1960, in 2000 there were a remarkable difference between the percentages of commuters in these four modes of transports. The percentage of train users are dropped to by 6%, tube by 3%, and bus by 10%. On the contrary, the car commuters percentage was showed a sharp increase of 15%.

In summary, the popular mode of transportation for commuting in 1960 was bus, in 1980, it changed to tubes and finally in 2000 in turned to cars. It is evident that, the living standard of the people in Europe has been changed remarkably in the period of forty years from 1960.


christyj   
Mar 3, 2013
Writing Feedback / To find a better job the T2 qualified people are moving to more wealthy countries - IELTS [5]

Hai Desilva,....

It is not the individual who is benefited but their native countries are also getting advantages by draining foreign currency and the new technology in the field of medicine, engineering and computer; i feel it is not the reason behind why professionals leave the country...?

In the same way, they will be provided with top ranked jobs and a well recognized working experience could be obtained ; this sentence is not clear to me...(.

your arguments for opposing the statement is not strong..

some points..

;the developed countries are enjoying the experts help in their country without spending money on them.
;in a poor country professionals and skilled labor are need to use their natural resources.
;poor country spent a lot of money from their tax to educate these professionals. so these professional should return it to the home country too by their services.

please avoid posting small messages like thanks.. they are the short cuts to suspension....).
if you like some body"s comment click the 'like' icon provided in the right side corner.
try to read some similar essays which is under the similar discussions...

CHRISTY
christyj   
Mar 3, 2013
Writing Feedback / (IELTS graph)Yearly percentage of home schooling in Some country during six years [2]

You are advised to spend a maximum of 20 minutes on this task.
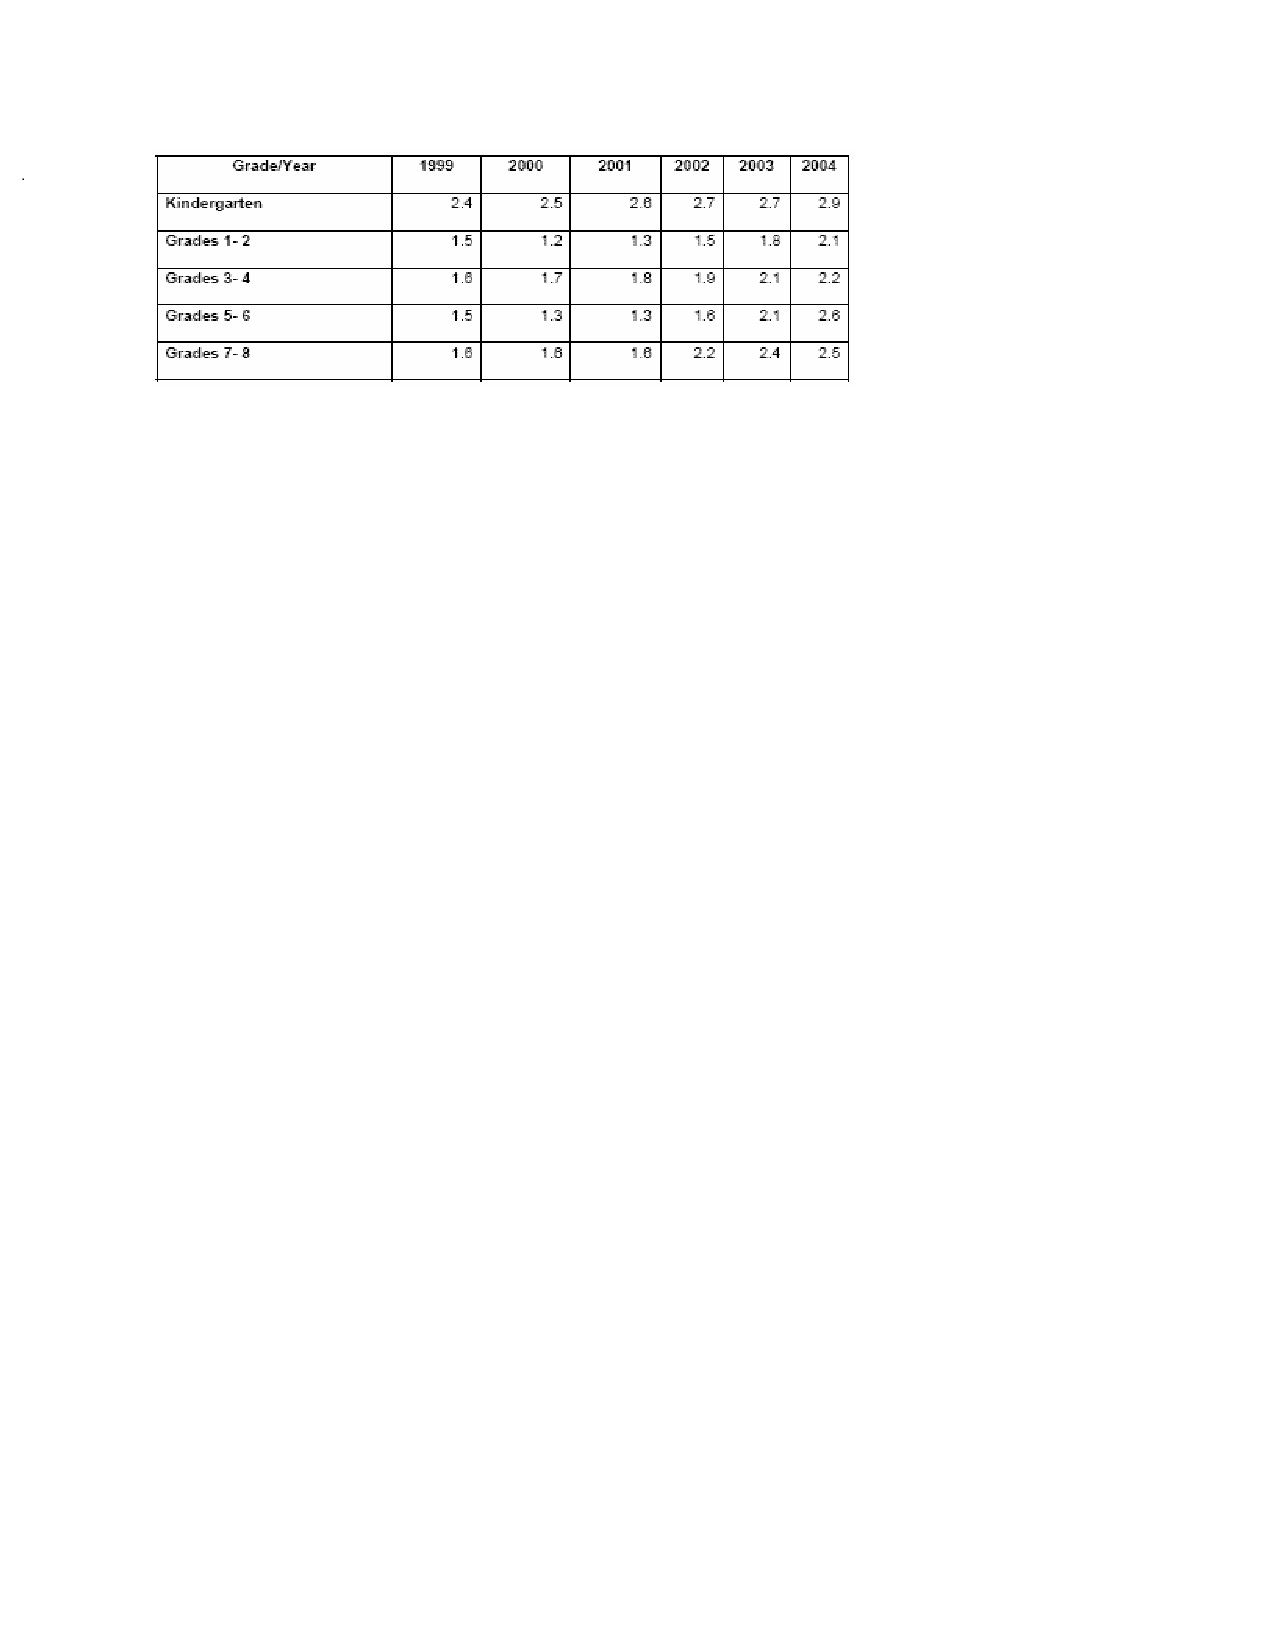
The table below describes percentages of home schooled students in SomeCountry in 1999-2004.
Write a report for a university lecturer describing the information shown.

The given bar chart describes the yearly percentage of home schooling in Some country during six years period from 1999 to 2004 in kindergarten, grade 1-2, grade 3-4, grade 5-6 and grade 7-8.

Overall, all grades showed an increasing percentage under the years of review, except grade 1-2 in 2000 and grade 5-6 in 2000 and 2001. There was a regular increase of .1% in kindergarten until 2001 and the stayed the same for next one year then ended with 2.9 in 2004. In grade1-2 the net increase in the percentage was .6% after 5 yrs. It rised from 1.5% to 2.1%. Though it dripped in 2000, it regained its popularity and increased thereafter. In grade 3-4 a regular gradual increase of .1% in all year except 2003, .3%. The total increase in percentage was .6%.

Grade 5-6 the percentage of growth showed an irregular trend. In 2000, it declined by .2% the next year, increase .1% and remained the same level followed by .3% in the following two years .5% in 2003 and 2004. The total rise in percentage is 1.1%. Grade 7-8 stayed same until 2001 in 1.6%, the next year doubled in 2003, increased by .2% and .1% in 2003 and 2004 respectively. The net percentage was .9%.

In brief, the trend of home schooling is gaining ground in Some country. Grade 5-6 showed the highest percentage of increase and kindergarten was the minimum in the six years under review.


christyj   
Mar 3, 2013
Writing Feedback / (ielts graph) leisure time in a typical week spend by male and female [4]

Hai Dumi, Wu and Desilva..

thanks for your great corrections..
it was really valuable about the grammar corrections....).
thanks again

Hi Wu..
though your corrections are already noticed by Dumi, thanks for your which you spent for me.

Hai Desilva..

thanks for your suggestion too

CHRISTY
christyj   
Mar 1, 2013
Writing Feedback / IELTS offenders should be sent to prison, or give alternatives such as community work [2]

Hai...

THE way she killed: may be typing mistake...

the prompt asked you to discuss about sending the offender to the prison or not. so in the introduction i personally don't feel you should say about capital punishment.

you can include, the positive impacts of community services for the offenders, and negative impacts of giving imprisonment.

read more essays in the similar discussions on the same topic, which just above the comment area, you will get some more points...).

Christy.
christyj   
Mar 1, 2013
Writing Feedback / IELTS; SPACE VS MALNUTRITION- Which is more important? [5]

Hai..

good essay..
space shuttles sent to the universe...?
number of ways. For instance, placing a satellite on the air has ease us with telecommunication and meteorological forecasts, space shuttles sent to the universe used for searching planets and an attention is paid to identify threats coming form the solar system.====number of ways.Space shuttles sent to the outer orbits are used for searching planets and an attention is paid to identify threats coming form the solar system. Placing a satellite on the air has ease us with telecommunication and meteorological forecasts. For instance, the weather forecasts which are done by the help of these satellites help to save the valuable human lives of people especially, those who are seeking their livelihood in the sea.

Christy
christyj   
Feb 28, 2013
Writing Feedback / Corporal punishment good or bad [6]

hai Mehak..

Try to add full question before starting the answer.
capitalize the sentence.
write clear opinion in the introduction.

read more essays. you can read more essays even in the topic of your essay in the similar discussions which is just above the comment area.

leave lines between paragraphs

your essay seems to be too short. try to put more words. and always try to follow the time..

Christy..
christyj   
Feb 28, 2013
Writing Feedback / (ielts graph) The computer and internet use per 1000 inhabitants in the Arab word. [3]

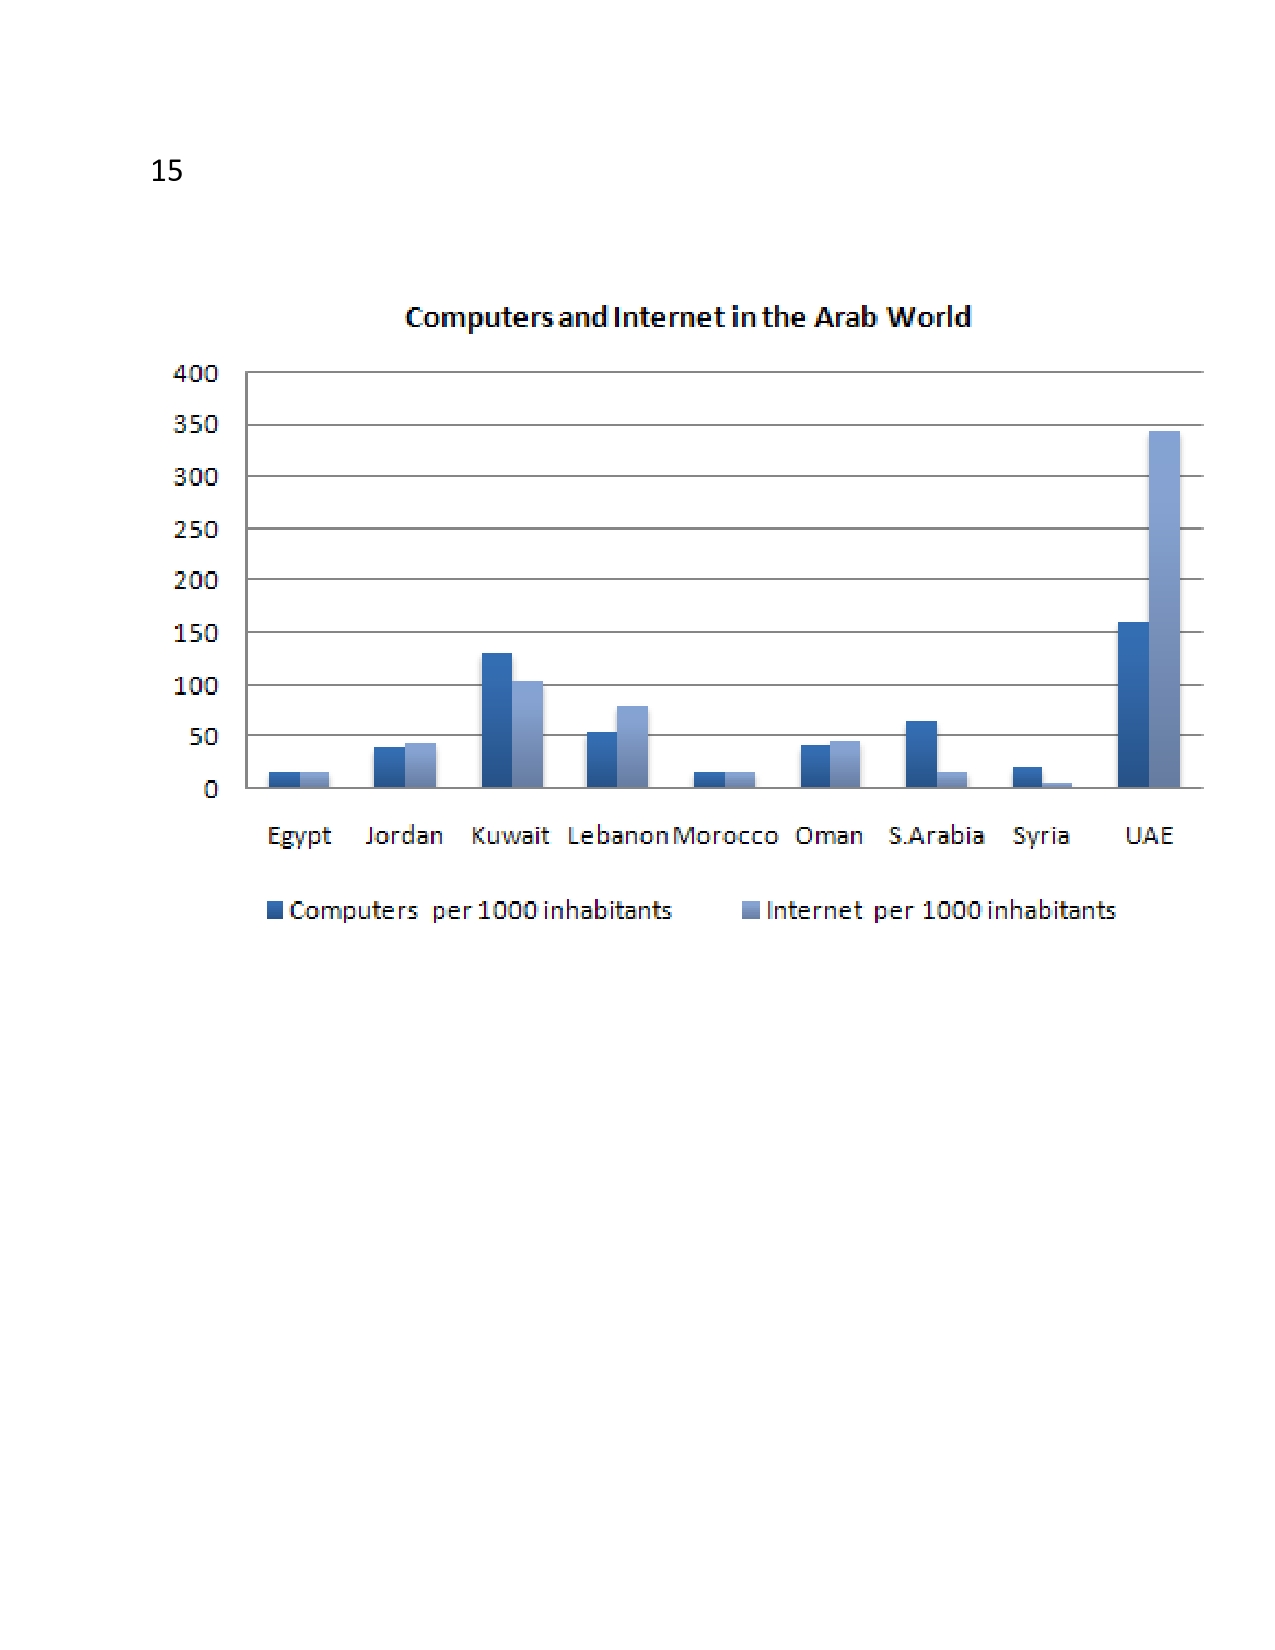
Write a report describing the information in the graph below.
- You should write at least 150 words.
You should spend about 20 minutes on this task.

The chart gives information about the computer and internet use per 1000 inhabitants in the Arab word.

To begin with, there were same number of people per thousand use computer and internet in Egypt and Morocco which are 20 in both categories. There is only a negligible difference between the computer and internet users in Jordan and Oman.

In Saudi Arabia, the computer users are three times more than that of internet users which are 60 and 20 per thousand users. Syria also followed the same trend with 20 and 5 users per thousand in both categories. In UAE, there is a remarkable difference in the number of users between computer and internet. Computer users 160, are only less than half of the internet users 345 per thousand users. In Kuwait and Lebanon, there were marginal differences between the two groups that are only 30 per thousand.

In summary, the popularity of the computers are higher than that of the internet users in Kuwait and Saudi Arabia, whereas it UAE, Lebanon, Jordan and Oman had been showed an opposite trend of popularity of the Internet.


christyj   
Feb 27, 2013
Writing Feedback / IELTS GT Writing Task 2: Problems the country face in next ten years [2]

Hai..

The prompt asked you to write about the problems of the country in the up coming 10 yrs...
the use of the word 'mainlanders' repeating somany time use synonims for it..

Think wider...
:can talk about pollution, i heard pollution is so high in china due to higer number of industries through medias...).
: severity of global warming, climatic changes...
:shortage of resources, the most important one you skipped, pertol..?
:living costs may increase due to inflation...

Your introduction and conclution..

I feel It is not up to the level which demanded the essay...(:
Pay attention to it also..

Try to read more essays..

Christy
christyj   
Feb 27, 2013
Writing Feedback / (ielts graph) leisure time in a typical week spend by male and female [4]

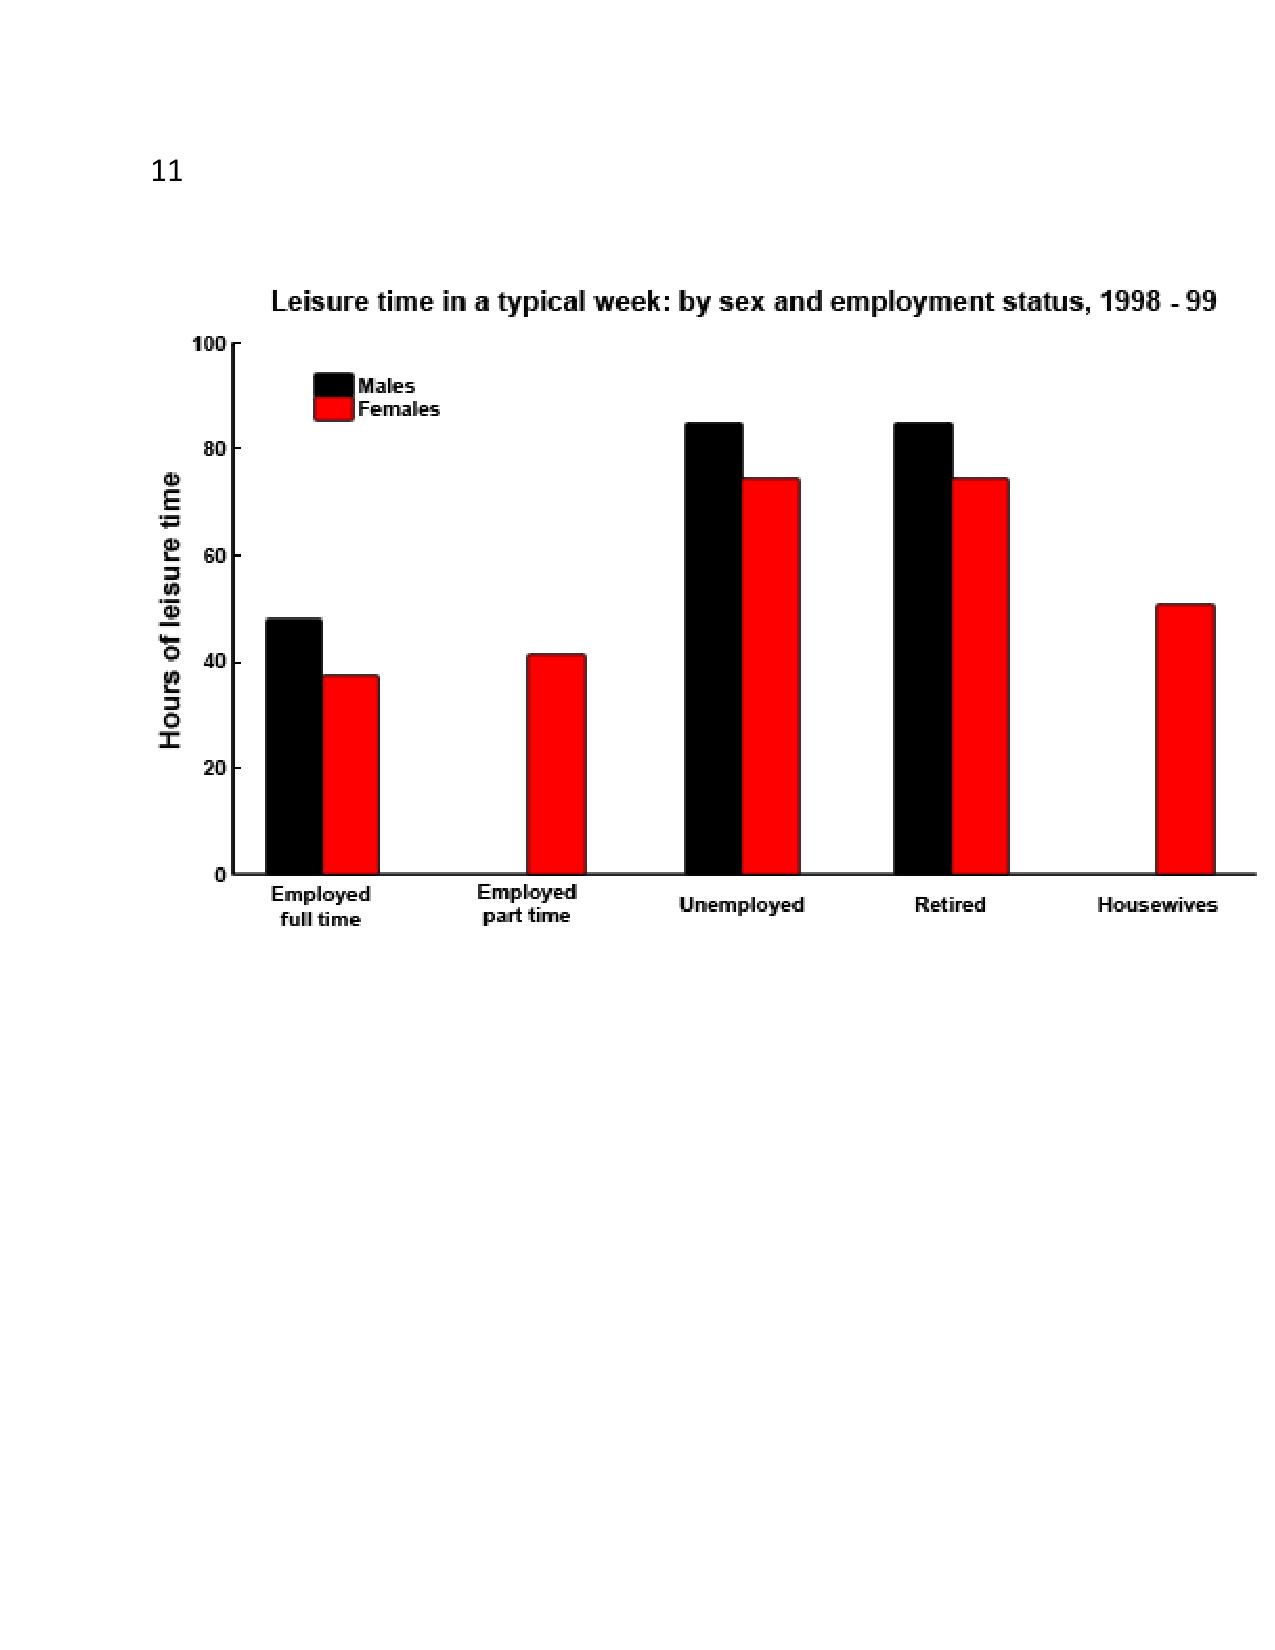
The chart below shows the amount of leisure time enjoyed by men and women of different employment status.
Write a report for a university lecturer describing the information shown below.
- You should write at least 150 words.
- Allow yourself 20 minutes for this task.

The given bar chart illustrates the leisure time in a typical week spend by male and female who are employed part time and full time, unemployed, housewives and retirees in the years 1998-1999.

Overall, the same number of hours are spend by employed and retired male and female which are 85 hrs and 80hrs period respectively. The same trend can be observed in case of women who are employed full time and part time that are 38 hrs and 40hrs respectively. Housewives are getting leisure time approximately equal to the number of hours of the full time employed men, fifty hours.

On the contrary, the number of leisure time spends by part time employed men are not available. Employed full time men spend only half the hours of leisure time than of the unemployed and retired man. In the same way, the number of hours spends by the unemployed, retired women are two times higher than that of part time, and fulltime employed women.

In short, men are enjoying more leisure time while comparing to women. However, the differences of number of leisure hours between the both sexes are minimal.


christyj   
Feb 27, 2013
Writing Feedback / IELTS essay 2 Achieving good health and fitness through physically demanding sports [3]

Hai...

Meanwhile, a well balanced diet consists of fresh fruits and vegetables are crucial for a healthy life and vaccination and other preventive measures, for example quitting smoking and alcohol carries an added benefit.

It is a long sentence...

Meanwhile, a well balanced diet consists of fresh fruits and vegetables, vaccination and other preventive measures are crucial for a healthy life. For example quitting smoking and alcohol carries an added benefit.

Therefore, concern on these aspects helps people to lead : Therefore, concern on these aspects HELP people to lead

i dodn't think while answering agree/disagree questions there is need of explaining the opposite side..if you are completely agreeing or disagreeing.

hope it is helpful for you..

Christy
christyj   
Feb 24, 2013
Writing Feedback / (IELTS graph) Death rates and Medical funds for Someland in 1990 [5]

Write a report for a university lecturer describing the information in the graphs below.
- You should write at least 150 words.
- Allow yourself 20 minutes for this task.
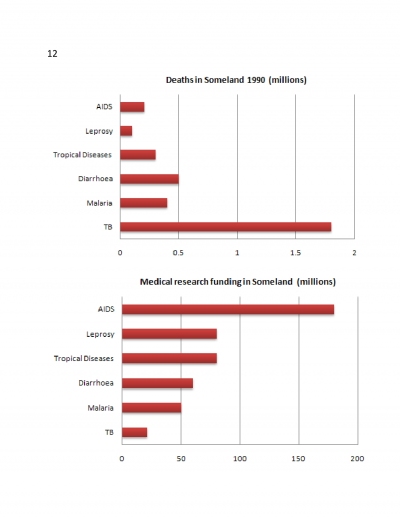
The given bar charts provide information regarding the death rates of someland and the fund allocated for six major diseases in 1990. These six categories of diseases included TB, AIDS, topical diseases, diarrhoea, malaria and leprosy.

At a glance, the deaths due to TB were the highest among the six categories, whereas, the money allocated for medical research of AIDS were the topest. Turning to detail, in the first chart, there were a marginal difference of 0.1 million deaths between the deaths due to topical diseases 0.3million and malaria 0.4millon. Diarrhoeal deaths were 0.5 million and it holded the second major cause of death. The least five causes of deaths were leprosy 0.1million, AIDS 0.2million, topical diseases 0.3million, and malaria 0.4million. The deaths due to TB were 2.5 times more than that of diarrhoeal deaths and was 1.8 million.

In the second graph, the funding for medical researches leprosy and topical diseases were roughly the same 75 million. The money allowed for the medical research of malaria and diarrhoea were 50 million and 60 million respectively. The least funds were given for the medical research for TB, which was only 30 million.

In short, although the deaths due to TB were the highest in Someland, least money was allocated for its research. The government in Someland recognized the importance of AIDS control and prevention and the highest amount of money is allowed for its medical research, though the deaths due to it was holding the fifth position in 1990.

Write a report for a university lecturer describing the information in the graphs below.
- You should write at least 150 words.
- Allow yourself 20 minutes for this task.


Writing
Editing Help?
Fill in one of the forms below to get professional help with your assignments:

Graduate Writing / Editing:
GraduateWriter form ◳

Best Essay Service:
CustomPapers form ◳

Excellence in Editing:
Rose Editing ◳

AI-Paper Rewriting:
Robot Rewrite ◳