dinafayna04
Aug 22, 2016
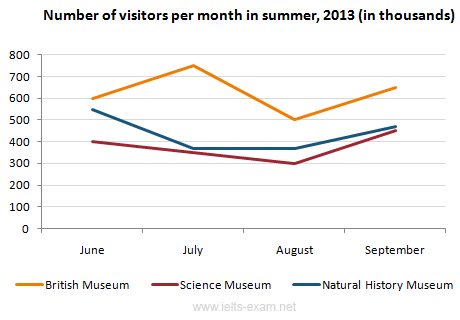
Writing Feedback / The line chart informs the quantity of tourists from three different museums in London monthly [3]
Question :
The line graph below gives information about the number of visitors to three London museums between June and September 2013.
Summarise the information by selecting and reporting the main features, and make comparisons where relevant.
The line chart informs the quantity of tourists from three different museums in London monthly, during a period from July to September in 2013. Overall, it can be seen that British Museum was the highest level of visitors during a four month, while the Natural History Museum saw the lowest figure of tourists visited.
To begin with, the British Museum started at 600 visitors in June. However the level had increased slightly by July and September (around 750 and 700 visitors respectively). The figure saw a sparse decrease in August, and finished at just under 700 tourists.
A part from previous comparison, the Natural History Museum stood at 410 tourists, the proportion had decreased noticeably in August (above 400), while the Science Museum stood at 55 tourists, the figure had increased significantly, either the Natural History and Science Museum, both of them saw similar pattern, and by the end of period the figure reached 450 visitors.

http://www.ielts-exam.net/academic_writing_samples_task_1/743/


