Unanswered [6] | Urgent [0]
  

Posts by bakhadeer
Name: Abdunabiev
Joined: Apr 7, 2014
Last Post: Jun 7, 2014
Threads: 6
Posts: 20  

From: Tashkent

Displayed posts: 26
sort: Oldest first   Latest first  | 
bakhadeer   
Apr 8, 2014
Writing Feedback / ielts; Teaching foreign languages broaden childrens horizons [7]

Teaching foreign languages is good in the primary school, but some people consider that they must be taught in the secondary school.
What other advantages and disadvantages?

As the world becomes more global , people will be recruited to be more efficient in communication. Early learning languages are somehow solution for a statement that mentioned. Despite the fact, some people believe that the teaching language is acceptable in secondary school.

First of all it is best to start early, because of enthusiasm in child is greater than his elder gender. As a result young members of our society can easily learn new words with mimic of pronouncation. Consequently, they can sing song and learn a little part of poems by heart, and read them to the audience. This means that they would feel confidence as well as develop useful skills.

In addition learning languages help to broaden childrens horizons, by giving information about other nations, their traditions and also their holidays.

We must aknowledge that, not all teachers in primary school are not best, even good qualified. Lack of attention in upbringing child and shortage of experience might have a negative impact.

We should carefully choose teachers that we want our children to studied and lived in their atmosphere.
bakhadeer   
Apr 8, 2014
Writing Feedback / ielts; Teaching foreign languages broaden childrens horizons [7]

Task 1
So I am going to pass an IELTS exam after some months, but I don't feel myself confident yet. Please read and give some recommendation to increase the quality of my expression of graph

The graph below shows in percentage terms the changing patterns of domestic access to modern technology in homes in the UK.

The line graph provides information about changing trends of domestic access in four different technologies in the UK, during the period between 1996 and 2003.
Overall, there was an increase in all of the mentioned number of technologies during the period shown.(or As the graph shows, there was a moderate rise in patterns of technologies, except for mobile phone with an upward trend)

In the beginning of the period, the highest percentage was owned by CD player, which stood at 60%, while the figures of home computer and mobile phone were respectively about 30 and 20 percent. The amount of Internet access was about 10% which is started only in 1998/99.

Access of CD player rose modesty, closely followed by mobile phone. In fact, just over 80% of users had players and slightly smaller percentage used mobile phone. While home computer showed a more steadily rise in comparison with Internet access, and reached peak at just over 50% and it continued domination under Internet access which was standing at 40% in 2002/03
bakhadeer   
Apr 8, 2014
Writing Feedback / ielts; Teaching foreign languages broaden childrens horizons [7]

Teaching foreign languages is good in the primary school, but some people consider that they must be taught in the secondary school.
What other advantages and disadvantages?

this is a theme of given topic. above you can see essey for TASK 2, and under that i wrote an example for TASK 1, but unfortunately i couldnt add a relevant graph.

can you give other suggestions?
bakhadeer   
Apr 9, 2014
Research Papers / Research proposal topic for finance, business, investments [5]

why are asking just for help?! how they can help if they have never seen your writing before?! it is only my opinion. i think the best way to achieving good results is just trying to write and wait for some comments. by that way you will understand your problems that you are facing
bakhadeer   
Apr 9, 2014
Writing Feedback / The contribution of three different sectors to the UK economy; 'agriculture 50%' [8]

Question:
The graph below shows the contribution of three sectors - agriculture, manufacturing, and business and financial services - to the UK economy in the twentieth century.

Answer:
The bar chart illustrates the charity (or contribution) of three sections, included agriculture, manufacturing and both business and financial services, to the UK economy, during the period between 1990 and 2000.

In the beginning of the twentieth century, the highest percentage of contribution belonged to agriculture at about 50%, closely followed by manufacturing sector with a little difference. The figure of business and financial sector had a tough position in the first decade of the age, at less than five percents.

In the 1950s, there was a slightly increase in all of the three different sections, except for productions ( or manufacturing) sector.
The situation modified thoroughly, with doubling in percentage of charity from business and finance, while the range of agriculture's contribution to the UK economy declined and showed five times smaller amount compared with 1900s result.

The proportion of agriculture closely in millennium was picked the lowest point ever had during the period shown. By contrast business and financial sector reached a peak at under 40%, ... the production (or manufacturing) sector saved its moderate point in correlation with two others.


bakhadeer   
Apr 10, 2014
Writing Feedback / IELTS Task 1. Estimated world illiteracy [9]

IELTS Graph #18

Write a report for a university lecturer describing the information below.
You should write at least 150 words.

Answer:
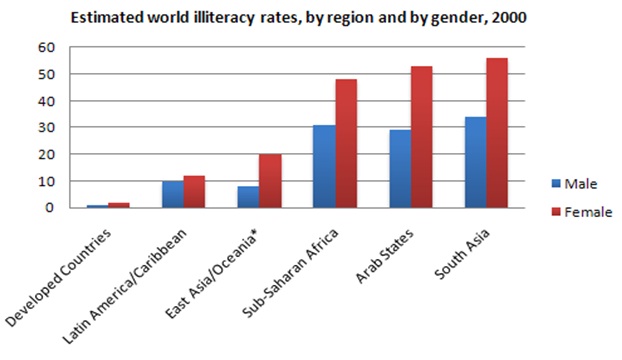
The bar chart provides information about estimated observation in world illiteracy rates by six different regions as well as by gender for the year 2000.

Overall, the proportions showed higher percentage than previous one, started from developed countries. The most outstanding rate of illiteracy was in South Africa and belonged to females at approximately 53 percent. There were almost identical levels of trends for men in three regions, included Sub-Saharan Africa, Arab States and South Asia, about 30 percent.

The figures for women, in three regions mentioned above were comparable to male results, and were between 48 and 66 percent.
East Asia and Oceania showed a moderate figure for females at 20%, while males rate was standing at 8 percent. There were similar outcome for both male and female in Latin America and Caribbean, 10(should I write in letters???) and 12 percent, respectively. The greatest percentage of literacy was in developed countries and at only in two percent female with one percent male verified lack of education (or knowledge)

In general (or In fact) female genders dominated in rate of illiteracy, by all given regions.

Check it please, and I will wait for your comments))


bakhadeer   
Apr 10, 2014
Writing Feedback / IELTS Task 1. Estimated world illiteracy [9]

you know i've just one sentence written to overview. but i have some problems in sentence order. however thanks for feedback))
bakhadeer   
Apr 11, 2014
Writing Feedback / IELTS Task 1. Estimated world illiteracy [9]

[quote=Pahan]previous one"? What do you refer to ?

i wanted to describe that latter had higher results than first, in order first is developed countries...
bakhadeer   
Apr 11, 2014
Writing Feedback / IELTS Task 1. Estimated world illiteracy [9]

hi pahan, as you said my conclusion is more suitable for overview, isnt it?

and can you give some instructions to summarize pie charts?

thanks dumi, i will follow to your suggestions
bakhadeer   
Apr 12, 2014
Writing Feedback / IELTS; Jewelry or concert tickets; What is more important for you? [6]

hi dumi, I'm about to write an essay topic like above. but I also confused with structure. there is one question. Is this an argumental question type? can you make paras with some examples for the same essay topic? plz if you can!
bakhadeer   
Apr 28, 2014
Writing Feedback / The charts: reasons why adults decide to study / shared costs of adult education [4]

The charts below show the results of a survey of adult education. The first chart shows the reasons why adults decide to study. The pie chart shows how people think the costs of adult education should be shared.

Summary:
The charts give information about results of a survey of adult education. The bar chart illustrates the amount of reasons to study among mature-aged people. The pie chart demonstrates the percentage of tuition fees must be contributed between three different groups. Overall, interest in subject is motivated striking number of adults to study, while the highest proportion of costs of each course is thought should have been paid by individual.

From the bar graph it is clear that interest in subject is surpassed decision to study to gain qualifications by 2%, at 40%. Three other reasons, helpfulness for current job, being able to improve prospects of promotions and enjoyment of learning/studying comprises similar rates at about 20%. The ability to change jobs and meeting people are accepted as least important with 12% and nine percent respectively.

Turning to the pie chart we can easily seen that, a quarter proportion belongs to taxpayer, while individual dominates with 40%. At least the rest of fees are believed should hold by employer.


bakhadeer   
Apr 28, 2014
Writing Feedback / The number of television sales annually from 1996 to 1999 [4]

it is hard to write at least 150 words by graph like this. there is not enough info. i suggest that try to do the whole task (i dont believe in Ielts writing task only this graph is given)

so overall, you did pretty good) go on. never never stop
bakhadeer   
May 12, 2014
Research Papers / Sleep Learning: Does it really work? [2]

so i think it really works. Listening to music while sleeping helped to many people to recreation. Indeed it may work in study))
bakhadeer   
May 12, 2014
Scholarship / Why I am a worthy candidate for this scholarship [5]

With the knowledge acquired in school, I hope to deliver optimal pharmaceutical care and attentive counsel on medicines for patients.
with the knowledge that I acquired...
overall you did pretty good. I appreciated it. I have not find any other mistakes. so go on and utilize your ability to write:)
bakhadeer   
May 12, 2014
Writing Feedback / the charts below give information about travel to and from UK. [6]

The charts below give information about travel to and from UK and about the most popular countries for UK residents to visit.

Summary:

The line graph compares the number of travelers had been visited to and from the UK, during the period between 1979 and 1999. The bar chart illustrates the amount of visits by UK inhabitants in five outstanding countries in the last year of period shown.

It can be clearly seen that, visitors to foreign countries dominated under the number of guests were visited the UK, while the most popular destination was accepted as France.

Starting with line graph we can easily get a picture that, there was a moderate increase in both trends until 1986, by eight and five per cent respectively. During other thirteen years they continued their rapid rise and reached a peak of above 50 millions and just under 30 millions.

As is shown in the bar chart, the most distinguished places chosen by UK residents at around 10 millions of people, were France and Spain. The United States showed a moderate result with four millions and was followed by Greece at about three millions. And the least proportion of visitors at only two millions, chose Turkey among five different countries.


bakhadeer   
May 24, 2014
Writing Feedback / IELTS - EFFECT OF CELEBRITIES ON YOUTH [3]

So, this example makes it obvious that these glamorous celebrities have a poor effect on the conduct of young people.

not a poor effect, potential effect sounds better
bakhadeer   
Jun 7, 2014
Writing Feedback / Ielts - Fast food popularity- Positive or Negative? [3]

Fast food is universally in most countries and is becoming increasingly popular. Some feel that this is a positive trend, while others do not. what is your opinion on this?

response:
The past few decades have seen a dramatic change in the popularity of fast food. Some people claim it as convenient and cheap, while others condemn its unhealthy components. Personally despite (((what i should write here??? Plz check my essay and give some examples to write)))

First of all, it is indisputable fact that fast food causes many major health problems. Consumption of foods such as fried chicken, hamburgers and chips, which are high in fat, results in ailment as obesity and high blood pressure. Lack of vital additives can also be responsible to mental illnesses.

Nonetheless being addicted to fast cooked dishes are harmful to health, we cannot completely ignore its convenience. Incredibly high pace in preparing such foods, is the only one solution when we are in a hurry. Moreover, its good placement (for instance near to the University) and working time ( 24/7 ) makes comfortable using their services, rather than looking for restaurants which is often costs money.

By way of conclusion, consuming fast foods will probably continue being preferable, especially among youngsters, as the demand of people to get their needs faster. Negative impacts to health will be reduced by limiting time of visiting such a places))
Writing
Editing Help?
Fill in one of the forms below to get professional help with your assignments:

Graduate Writing / Editing:
GraduateWriter form ◳

Best Essay Service:
CustomPapers form ◳

Excellence in Editing:
Rose Editing ◳

AI-Paper Rewriting:
Robot Rewrite ◳