arisandy14
Sep 13, 2016
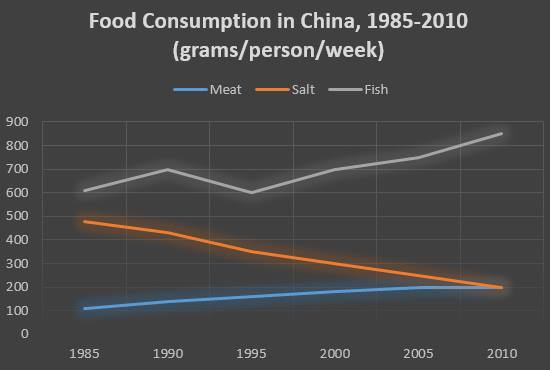
Writing Feedback / IELTS task 1 The diagram illustrates the change of food consumption in China in quarter century [4]
The diagram illustrates the change of food consumption in China in quarter century.
In the first year, fish was the most popular with consumption of 600 grams per-person per-week. Then, the statistic went up 100 before slumping in the same position from the first year in 1995. The following years, there was an upward trend tremendously until 2010.
The figure for salt experienced the plunge considerably. In 1988, It was approximately begun about 420 grams per-person per-week and consistently decreased until 200 grams in 2010. In contrast, it was totally different from meat consumption undergoing the growth gradually. This surge was started 100 grams per-person per week and markedly rose until it had the same point with which was reached by the salt consumption in 2010.
In conclusion, even though fish consumption encountered the significant rise, it ever underwent the fluctuation happening in 1995. In contrast, salt consumption instead experienced the fall from beginning to the end year.

14355140_10205834051.jpg


