hgianghgiang
Sep 27, 2017
Writing Feedback / [IELTS writing task 1] Line graph: spread consumption [3]
The graph below shows the consumption of three spreads from 1991 to 2007.
Summarize the main features and make comparisons where relevant.
Please help scoring this essay. My test is in 3 days' time!!
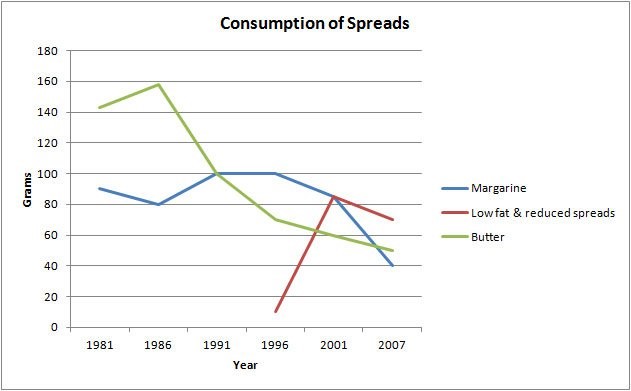
The given line graph visualizes the information on how much three types of spreads were consumed between 1981 and 2007. Units are measured in grams. Overall, despite being popularized from a much earlier time, butter and margarine intake declined throughout the years. The pattern was reversed for low fat and reduced spreads however.
In the initial year, butter dominated with over 140 grams consumed. The number then rose to a peak of almost 160 grams in 1986. From this point, butter intake went through a crash to approximately 70 grams in 1996 and further to 50 grams by the end of the recorded period.
With regards to margarine, its consumption began with around 90 grams before reaching the highest figure of 100 grams in 1991. Remaining unchanged in the following five years, the figure then experienced the same downturn similar to that of butter, finishing at 40 grams.
On the other hand, the year 1996 marked the emerge of low-fat and reduced spreads. Since then, this kind of spread began to gained popularity with a remarkable speed. In 2001, the reported consumption stood at above 80 grams, which was equal to that of margarine. It then fell slightly to 70 grams in 2007, classified as the most prevalent choice of spreads.
[211 WORDS]
The graph below shows the consumption of three spreads from 1991 to 2007.
Summarize the main features and make comparisons where relevant.
Please help scoring this essay. My test is in 3 days' time!!
margarine, low fat and butter consumption
The given line graph visualizes the information on how much three types of spreads were consumed between 1981 and 2007. Units are measured in grams. Overall, despite being popularized from a much earlier time, butter and margarine intake declined throughout the years. The pattern was reversed for low fat and reduced spreads however.
In the initial year, butter dominated with over 140 grams consumed. The number then rose to a peak of almost 160 grams in 1986. From this point, butter intake went through a crash to approximately 70 grams in 1996 and further to 50 grams by the end of the recorded period.
With regards to margarine, its consumption began with around 90 grams before reaching the highest figure of 100 grams in 1991. Remaining unchanged in the following five years, the figure then experienced the same downturn similar to that of butter, finishing at 40 grams.
On the other hand, the year 1996 marked the emerge of low-fat and reduced spreads. Since then, this kind of spread began to gained popularity with a remarkable speed. In 2001, the reported consumption stood at above 80 grams, which was equal to that of margarine. It then fell slightly to 70 grams in 2007, classified as the most prevalent choice of spreads.
[211 WORDS]

302420_1_o.jpg


