Unanswered [3] | Urgent [0]
  

Posts by Bunglon11
Name: Hadi Kuncoro
Joined: Jan 18, 2016
Last Post: Mar 6, 2016
Threads: 28
Posts: 31  
Likes: 5
From: Indonesia
School: State University of Makassar

Displayed posts: 59 / page 2 of 2
sort: Latest first   Oldest first  | 
Bunglon11   
Feb 20, 2016
Writing Feedback / IELTS TASK 2 - CHILDREN LABOUR SHOULD BE CONSIDER AS VALUABLE WORK EXPERIENCE [3]

Hi Awe_28 let check your essay

At the present time, many adolescents have been become employed younger labourers in several countries.
... while the other sides statesprecious valuable job experience can be obtained. Whilst adolescent workers can disturb children focus influece their focus, (...) can be developed by themthe time in their work .

you have to use appropriate vocabulary in your essay.
Bunglon11   
Feb 20, 2016
Writing Feedback / Underground railway system in different cities - main features and comparisons where relevant. [2]

The table below gives information about the underground railway systems in six cities. Summarise the information by selecting and reporting the main features, and make comparisons where relevant.

A breakdown of the information system of the underground railway in London, Paris, Tokyo, Washington DC, Kyoto, and Los Angeles since opened in different years, and is measured by kilometres (km) of the route and millions of passengers per year. At first glance, there was a significant dominance in the number of passengers among the cities. While the highest number was shown by Tokyo, Kyoto presented the reverse.

Moving to a more detailed analysis, the highest number of passengers was dominated by Tokyo, which was opened in 1927 with route 155 km, 1927 million passengers. In contrary, the shortest route and lowest passengers were experienced by Kyoto since it has been promoted in 1981, which was followed by Los Angeles, as the newest opened in 2001, and Washington DC in 1976, that had 50 and 144 million passengers.

Turning to the next analysis, Opened in 1900 with 199km length, Paris attracted 1191 million of passengers. Interestingly, London, which had the longest route around 394km length, had passengers 775 million since it was published in 1863.


Bunglon11   
Feb 20, 2016
Writing Feedback / The main reason why workers tend to devote themselves in a company is the given wage. [2]

hi @ Riiskacha03 let me check your essay

The main reason why a worker tends to devote to themselves in a company ... I immensely agree that, this is the only people's incentive.

... working in the same office for a long time, due to the given salary ...
This is because,a majority of workers (...) other indefinite jobs which may lead to ...
... and would not be replaced by newly qualified laborer and (...) position which had a possibility of greater wages.

... profession which has a higher salary, it would affect their decision, whether they would stay in ...

be careful, you have to combine your sentences into a full paragraph not separated.
Bunglon11   
Feb 20, 2016
Writing Feedback / 'freedom from addiction' - The best way to get rid of someone's drug dependence is rehabilitation. [2]

hi @awe_28

Let me check your essay

... done an action which against the rule, while others state ...

Regarding drug users should be prisoned, it is acceptable for (...) illegal things that they have been done like the other criminals.

your explanation in this body is not really clear, you have to explain more and what the effect from your example.
Bunglon11   
Feb 20, 2016
Writing Feedback / A breakdown of the inhabitant percentage aged 65 and more in USA, Sweden, and Japan [2]

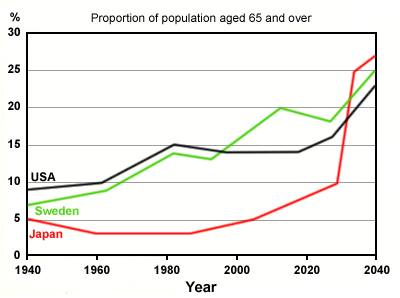
The graph below shows the proportion of the population aged 65 and over between 1940 and 2040 in three different countries.

Summarise the information by selecting and reporting the main features, and make comparisons where relevant.


A breakdown of the percentage inhabitant aged 65 and more in USA, Sweden, and Japan since 1940 and is predicted until 2040, is illustrated in the line chart. At first glance, there were three different trends in the proportion of population among three different countries. While the USA and Sweden show the fluctuation trend, Japan shows extremely increase in the future.

Moving to a more detailed analysis, standing at 9%, USA held the dominance in the first period in 1940, which was followed by both Sweden (7%) and Japan (5%) at the second and third. During 1940 to 1980, USA and Sweden experienced an increase and declined slightly over the following year in 1990. However, a slight decrease is witnessed by Japan in the early and remained stable over the same period.

Turning to the next analysis, a significant rise was presented by Sweden through USA over a 10-year period from 1990 to 2010, rose to a fifth (20%), and is projected experiencing a increase of a quarter (25%) in 2040 when in the same period, USA remained unchanged prior to being predicted rise significantly in 2040, at 23 percent. Interestingly, Japan, as the lowest during the early and middle period, is projected witnessing an extreme increase and peaks at 27% in 2040.


Bunglon11   
Feb 20, 2016
Writing Feedback / Childcare places are preferable for busy societies but grandparets are the right choice for toddlers [2]

Hi Awe_28 let me check your essay

I have read it, I have some corrections

A majority of people regardS that childcare centers offer ... This is due tobecause (after due to only "noun" without s v) the staffs have been trained for a long time and given ...

Taking American Red Cross Childcare asan example, before it (...) period training to passsome goalsgain some qualifications and ready becomeing a babysitter. This is results in The American Red Cross becomes the leading of babysitting classes ...
Bunglon11   
Feb 20, 2016
Writing Feedback / Government spending on public services? Facilitating art is not a money waste too. [2]

Many countries spend a lot of money in art. Some people think investment in art is necessary, but others say money is better spent on improving health and education.

Discuss both these views and give your own opinion.


Art is becoming popular nowadays when some countries more likely to spend their budget to subsidise the art. It is argued that government should spend their money in public services such as hospital and school even though others believe that facilitating art is not waste money. Although I personally agree that government should spend much for public service, providing some budget for art is also can be conducted for some reasons.

There are several reasons that why spending amount of money for public facilities is important. This is because public service such as hospital and school are needed for citizen where those are related to health and education, which are basic needs of the human for encouraging quality of life. For example, If the government does not spend the amount of money in the hospital, it will lead the unhealthy life for the citizen. Similar to this, if the government does not provide facilities for education, how people particularly children and young generation obtain the education. As a consequence, those are more likely to lead the poor quality of life in a society that tend to cause other problems in different aspects.

However, this does mean that subsidising money to the art should be stopped. Firstly, art is a part of human life that cannot be separated because the great pleasure to improve the quality of life is coming from the art, as an entertainment. Moreover, art is one of the local cultural heritage of ancestor that should be preserved because it is an identity of the country such as traditional dancings, songs, or instruments. Also, art is able to bring benefit to the government that can be used to facilitate other aspects.

To conclude, spending money for public service is more likely to encourage society well-being for the citizen. While on other hand, art is said that it is not the primary need for all people in a country, I personally believe that both public service and art should be paid more attention because both of them are needed to improve better life for the citizen.
Bunglon11   
Feb 20, 2016
Writing Feedback / Societies argue that people using drugs are better being jailed than delivering them to the rehab. [3]

Hi indah_hai..let me check your essay

Societies argue that people using the drug is are better getting jailed than ...

When the drug user is in this situation, the possibility to of harming themselves or people surround... In reverse, I believe that addicting of the drug is a pattern of an unhealthy condition and it is not a crime.

... getting addicts to rehabilitation might be an optional.......... I believe that giving another chance to have a normal life is naturally meaningful ...

In conclusion, although harmful behaviour among addictive people seems to be serious problem (...) healing and giving theman opportunity to have better life is recommended way. I am likely to recommend the government to take part to acknowledge...

in your first body, you should analyse the explanation, please recheck your supporting idea, when I read it, it is far from the main idea because in your main idea you explain about the punishment for the drug user, but in supporting idea you explain about the effect of drug usage
Bunglon11   
Feb 20, 2016
Writing Feedback / IELTS TASK 2 children should only focus on their study or not [2]

Some would argue that children should focus on their study, while others think ... While working children is are apparently wrong as they are ...

It is avoidable that children aged less than 18- year- old are still not ready enough to ...
However, a current study conducted by Bruce Joyce in Arizona University uncovered ...

(it will be better if you explain what the consequence or the effect after you give the example)
......... It is thus having valuable experience related to the job is highly recommended for children below the age of 18.

..........working in at the same time, I am more likely to ... Therefore, the government and other parties should ...
Bunglon11   
Feb 18, 2016
Writing Feedback / A breakdown of a wind turbine design as an another Source of Renewable Energy [4]

The diagrams below show the design for a wind turbine and its location.

Summarise the information by selecting and reporting the main features, and make comparisons where relevant.


A breakdown of a wind turbine design and three different locations to be placed, is illustrated in the diagrams. At first glance, a wind turbine contents several parts, which has their each function. There are three different places that can be used to put the turbine.

Moving to a design, a wind turbin feature consists of blader-fibreglass/wood, steel tower, wind sensor, generator, and computer. Each part of the turbine has a function such blades, which is as a receiver of wind. Then, wind sensor is used to detect speed and direction which is followed by generator as a power producer with output 1,5 megawatts of electricity. Moreover, another component is a computer to receive information from the sensor. All parts are combined to construct a wind turbine to be used as an electrical source.

Turning to the locations, there are three different locations that can be used to place the turbin. The first, on the hill, in this place the maximum wind strenghts can be obtained. The second, it is in the sea with landscape not spoiled, and another place is near home as a domestic turbine that is able to produce 100 kilowatts electricity.


Bunglon11   
Feb 18, 2016
Writing Feedback / Improving social-media equipment in this era has an impact on communication among human beings [3]

Hi ADIE08, Let me check your essay

Improving social media equipment device in globalization era ...

First and foremost, the bigger serious/main the impact of the electronic media as the communication makeS a longer relationship (...) to face and interactS with other people. For example, baseD on research by Global Network,showed that most of the people (...) communicate with the otherS rather than by faced direction.In which sometimes people lived some home to do that activity. As a consequence, most of the people in the world have a less ...

In addition, the other drawbackS of the high media ...

You have to be aware about your grammatical error
Bunglon11   
Feb 18, 2016
Writing Feedback / Electronic media can cause several disadvantages on personal relationships between humans. [7]

Hi Putri22, let me comment your essay

Technology can change everything. It is believed that electronic media such as mobile phone or laptop bring several disadvantages on personal relationships between humans . I strongly agree with this statement because such media may affect the users to become addicted and more individual.

To begin, convenient electronic media leads people to carry them everywhere because people cannot control themselves to not checking their gadget even in the morning when they wake up, the first thing that they do is checking their mobile phone. Such behavior causes them to be gadget addict and break their relationships with other people. To illustrate, it can be seen nowadays many couples who eat together in the restaurant do not speak each other a lot because they only focus on their mobile phone. As a consequence, their quality of relationship will decrease and make them more individual.

On the other hand, such media also havehas positive effect onfor helping people to communicate with their relatives or their friends who live far from their city. A student who studies abroad definitely needs laptop or mobile phone to keep contact with his or her family. They use applications such as facebook or skype on their gadget to have chat or video call each other.

You need to enlarge your idea
you should focus on the question, your explanation is far from the topic
Bunglon11   
Jan 28, 2016
Writing Feedback / Both parents and schools hold the roles for children healthy lifestyle [2]

Many children these days have an unhealthy lifestyle. Both of schools and parents are responsible for solving this problem. Do you agree or disagree?

It is argued that both parents and school hold the crucial role that have high influence to young child health activities. While other aspects have important impact, I personally argue that both parents and school are the best role model for the children.

It is true that both parents and school have more responsibilities to kids' activities because most of their time is spent at home and school. Parents as the role model hold the crucial aspect for the habit. For instance, activities such as stay up, a lots media usage, activity out of home, and nutrition have to be controlled by parents who have high authority at home. In school as the second home for students, have to lead student activities when they are uncontrolled by their parents. The teachers must introduce student to always live clean such as throwing the trash into the rubbish box, washing hand habit, cleaning room. Those are able to show how to live better. As a result, when young child copy good role model from their parents and follow the regulation from the school, those are able to lead them into health activities. It is clear that both parents and school should be aware of students activities to direct them in better way of life.

However, this does not mean that the other factors should be completely neglected. Media, as the public advertisement, holds the important role to publish the healthy lifestyle program. Government as highest authority holder must be more responsible about life changes in its country. It should develop the regulation which is able to lead the citizen to face better life. Ministry of health should take a part for health activities for the residences. Health authority should promote the health prevention for the youth generation. It is clear that all of parts in a country should take part in prevention of lifestyle change to face the challenge of worldwide development.

In conclusion, I personally believe that both parents and school are the most crucial aspects since their responsibilities are needed to lead young children activities to better way of life. Other factors should take part to influence the healthy lifestyle.
Bunglon11   
Jan 21, 2016
Writing Feedback / Different household spending during 60 years [4]

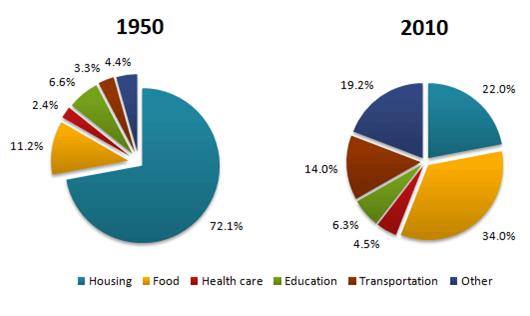
The pie charts below show the average household expenditures in a country in 1950 and 2010.

A comparison of the percentage household spending in a country between two different years,1950 and 2010, is illustrated in pie charts. At first glance, it is inevitable that there were significant change in the percentage of household spending at several different sectors. While the percentage of housing expenditure decreased significantly, food spending showed the opposite.

Moving to detailed analysis, the percentage of housing expenditure showed a dramatic decrease over a 60-year period, stood at 72.1% in 1950 and fell extremely around a half at 22 percent in 2010 which was followed by education which decreased slightly at 6.6% to be at 6.3 percent. By contrast, the percentage of food spending increased significantly from 11.2 percent to more than a third in the same period.

Turning to the next data, the percentage of transportation expenditure showed a rise around one in ten percent, 3.3% in 1950 to 14 percent in 2010. Then, it was followed by health care which increased at a small amount. 19.2% of increase is presented by other sectors over that period.


Bunglon11   
Jan 20, 2016
Writing Feedback / Consumption of energy in the USA in the Past and Future [2]

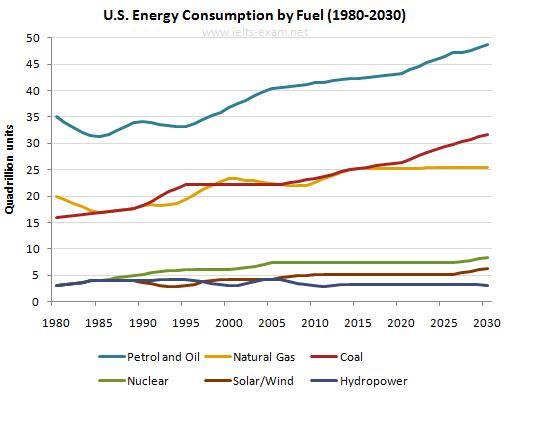
The graph below gives information from Annual Energy Outlook 2008 about consumption of energy in the USA since 1980 with projection until 2030.

A breakdown of Power Consumption by Fuel in United States over a half-century period since 1980 with prediction till 2030 reported by Annual Energy Outlook 2008 and is measured by quadrillion units, is illustrated by line chat. At first glance, there is a significant difference in the number of fuel usage for energy consumption in U.S. while Petrol and Oil usage is predicted to continue rising, Hidropower shows the reverse.

Moving to the detailed analysis, the number of power consumption was dominated by Petrol and Oil which stood at 35 quadrillions. Although 1980 to 2000 showed a fluctuation decrease, there was a regular rise after that year and is projected to increase continually till 2030 at more than 47 quadrillions. However, starting at the same position in the lowest number, Nuclear, Solar/Wind and Hidrowater showed the fluctuation pattern. While the Nuclear and Sloar/Wind increased slightly and is predicted remaining constant, the Hidrowater usage is projected to drop slowly.

Turning to the next information, the number of Natural Gas and Coal usage witnessed a erractic pattern. Although Natural Gas was more dominance at the first period than Coal, at approximately 20 quadrillions and 16 quadrillions, over a 10-year period from 2020 to 2030, Coal is projected rising significantly through Natural Gas which is predicted remaining constant in the last period.


Bunglon11   
Jan 20, 2016
Writing Feedback / Estimation of using fuels of American [3]

desgit33 Let me correct your essay

The line chart shows how many production of six kinds of fuel THE NUMBER OF POWER CONSUMPTION based on the amount NUMBER of people using energy in America from 1980 to be was estimated in PREDICTED 2030 and is measured in BY trillion units per five yearsby using IN Annual Energy Outlook 2008. At first glance, it can be seen OBVIOUS that, there has been an upward ...

... petrol and oil having HAD the largest number consumed by many American, it WAS begaU n at 35 quadrillion units and was predicted TO be able to reach the biggest consumption ...

... gas was larger than coal,. Oo therwise, the prediction IS in 2030 .
Interestingly, hydropower was IS projected to be the smallest production in 2030.
Bunglon11   
Jan 19, 2016
Writing Feedback / Expenditure, Inhabitant and Consumption of Resources in the world [4]

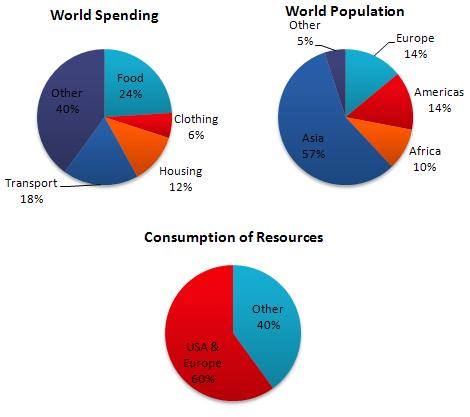
The pie charts below show World Spending, World population and Consumption of Resources.

A breakdown of Expenditure, Inhabitant, and Consumption of Resources in the world which are measured in the percentage, are illustrated by the pie charts. At first glance, that is obvious that there are different percentage of expenditures by people in the world. Consumption of resources is dominated by USA and some countries in Europe. A significant difference is shown in the number of population among some continents.

Moving to population in the world, the significant percentage of population in the world is extremely dominated by Asia, at nearly three-fifths. In spite of that, Africa shows the reverse at one in ten. On the other hand, Europe and Americas present the similar pattern of population, at 14 percent followed by others that stand at a very small number.

Turning to the expenditures in the world, the expenditure for food holds the highest percentage in the world spending at practically quarter which is followed by transport as the second that shows 18 percent and housing spending is twice as less than food expenditure. By contrast, clothing spending stands at the least proportion that explains solely 6% and 40 percent for other spending. Interestingly, the highest proportion of resources consumption are dominated by USA and Europe that show at 60 percent than others which are solely two-fifths.


Bunglon11   
Jan 19, 2016
Writing Feedback / The rate of students who passed major examination in high school [5]

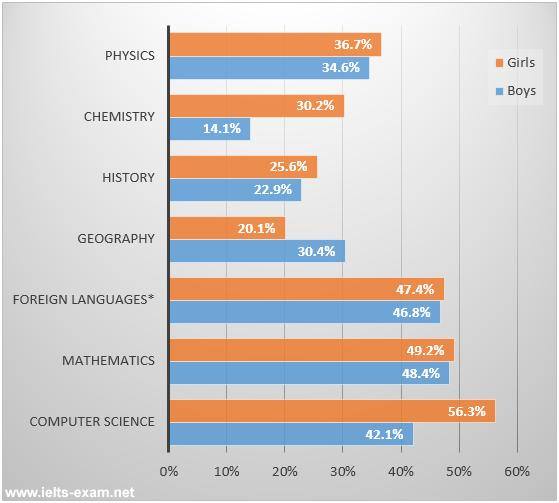
... percentage of students who passed THE major examination in high school that divided by gender ...
Overall, it is important to note that females who passed the exam was dominated WOMEN WERE DOMINANCE WHO PASSED THE EXAM in this rate. The percentage of STUDENTS WHO PASSED THE computer science was dominated BY females, whereas geography is WAS the favorite lesson for males.

... women in computer science by AT 56.3% compared by men at 42.1%. Subsequently, MATHEMATICS WAS the most favorite lesson by FOR males that mathematics at 48.4% but the percentage SHOWED THAT of women more higher than men, which ...

Turning to the social sciences, the geography was the most popular lesson for men. There was reached 30.4% and the women saw two-third from the percentage of men . However, the number of history lesson was experienced a through 2.7% more better females. Whilst foreign languages also showed high percentage in this rate, both of females and males witnessed less than a half proportion.
Bunglon11   
Jan 18, 2016
Writing Feedback / The Percentage of student passed the exam [2]

The bar chart below shows the percentage of students who passed their high school competency exams, by subject and gender, during the period 2010-2011.

The bar chart illustrates the percentage of high school students who passed the final exam in several subjects based on the gender in a 12-month period between 2010 and 2011. At first glance, it is inevitable that there were several differences in the subjects that both of gender passed the final exam in high school. while females showed the dominance at most of subjects, geography was dominated dramatically by males.

Based on the data, there was a significant difference between men and women who passed the high school final exam in several lessons. Computer science saw a significant range between men and women who passed this lesson, women 56.3 percent and 42.3 percent for men which was followed by the chemistry that presented women twice as much passed the final test than men, approximately less than a third for women and less than a fifth for men. However, there was a dramatic difference both of sexes in geography which were dominated by men, 30.4% and women 20.1% during that period.

On the other hand, there were slightly differences among several subjects. Both of Mathematics and foreign languages showed very small number differences. Likewise, physics and history explained the similar pattern even though those were dominated by females, no more than 3 percent over a year.


Do You Need
Academic Writing
or Editing Help?
Fill in one of the forms below to get professional help with your assignments:

Graduate Writing / Editing:
GraduateWriter form ◳

Best Essay Service:
CustomPapers form ◳

Excellence in Editing:
Rose Editing ◳

AI-Paper Rewriting:
Robot Rewrite ◳