Traveler
Sep 15, 2013
Writing Feedback / IELTS - CAM 5; three different countries population compare [4]
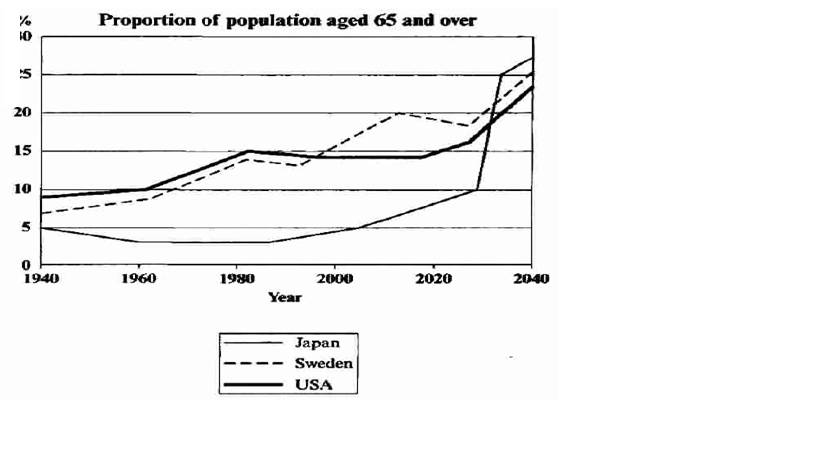
The graph below shows the proportion of the population aged 65 and over between 1940 and 2040 in three different countries.
Summarise the information by selecting and reporting the main features and make comparisons where relevant. (Cambridge ielts 5, page 29)
This is my answer
The line graph provides information about the percentage of people with an age of 65 years or more in the USA, Japan and Sweden, from 1940 to 2040. Overall, it reveals that the proportion of elderly people will increase, particularly in Japan, by the year 2040.
In 1940, aged people in Japan and Sweden were around 5% and 7% of the population respectively. On the other hand, the figure for the USA was higher, at about 9% of the population. From 1940 to 1990, the percentage of elderly people, both in the USA and Sweden, went up gradually to approximately 15% and 13% respectively. By contrast, the figure for Japan decreased to almost 3% during the same period.
By 2040, the proportion of people aged 65 and over is expected to rise further in the USA and Sweden, and reach 23% and 25% respectively. Moreover, the figure for Japan is estimated to increase sharply between 2030 and 2040, and reach 27% by the end of the period.
Any comments are appreciated. Thanks

ielts5test1.png


