Unanswered [14] | Urgent [0]
  

Posts by Traveler
Joined: Sep 14, 2013
Last Post: Nov 10, 2013
Threads: 6
Posts: 14  
Likes: 2

Displayed posts: 20
sort: Oldest first   Latest first  | 
Traveler   
Sep 15, 2013
Writing Feedback / IELTS - CAM 5; three different countries population compare [4]

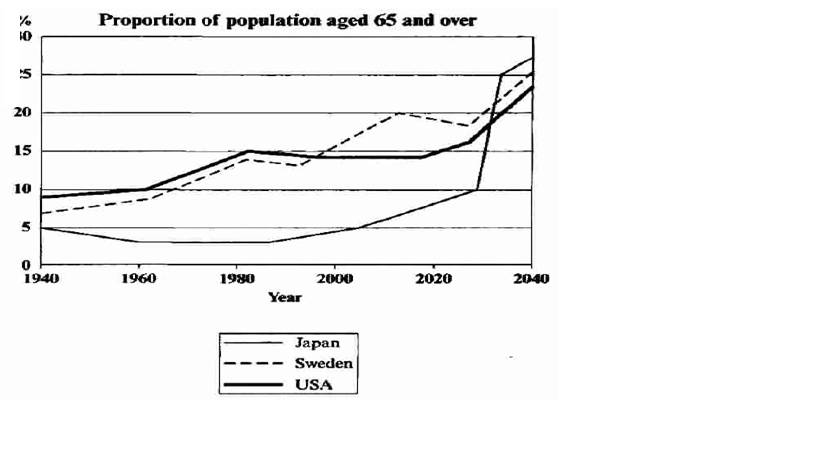
The graph below shows the proportion of the population aged 65 and over between 1940 and 2040 in three different countries.
Summarise the information by selecting and reporting the main features and make comparisons where relevant. (Cambridge ielts 5, page 29)


This is my answer

The line graph provides information about the percentage of people with an age of 65 years or more in the USA, Japan and Sweden, from 1940 to 2040. Overall, it reveals that the proportion of elderly people will increase, particularly in Japan, by the year 2040.

In 1940, aged people in Japan and Sweden were around 5% and 7% of the population respectively. On the other hand, the figure for the USA was higher, at about 9% of the population. From 1940 to 1990, the percentage of elderly people, both in the USA and Sweden, went up gradually to approximately 15% and 13% respectively. By contrast, the figure for Japan decreased to almost 3% during the same period.

By 2040, the proportion of people aged 65 and over is expected to rise further in the USA and Sweden, and reach 23% and 25% respectively. Moreover, the figure for Japan is estimated to increase sharply between 2030 and 2040, and reach 27% by the end of the period.

Any comments are appreciated. Thanks


Traveler   
Sep 16, 2013
Writing Feedback / IELTS - CAM 5; three different countries population compare [4]

MisterWandering
Thanks for the reply, I used "aged people" to avoid repeating elderly people one more time! I'm not a native speaker, so I don't know if it sounds awkward. Will "older people" be more appropriate?

Another thing, is the punctuation ok?
Traveler   
Sep 17, 2013
Writing Feedback / Writing Task 1: The pie chart; People living in poverty in the UK [5]

The pie chart illustrates the percentage of various types of families lived in poor conditions in Britain in 2002.

The pie chart illustrates the percentage of British people living in poverty in 2002 classified by family type.
The pie chart provides information about the poverty rate among six(?) types of families in the UK in 2002.

Try to use official cambridge past papers to practice (the chart you've posted is actually a table, see the attached image), in this way you should have more possibility to compare your own work.

Hope this helps


Traveler   
Sep 18, 2013
Writing Feedback / IELTS - CAM 4 - TASK 1 - DEMAND FOR ELECTRICITY IN ENGLAND [6]

The graph below shows the demand for electricity in England during typical days in winter and summer. The pie chart shows how electricity is used in an average English home. Summarise the information by selecting and reporting the main features, and make comparisons where relevant.

This is my answer

The line graph compares the daily consumption of electricity in England in two different seasons, winter and summer. The pie chart provides information about how electricity is consumed in a typical English household.

It is noticeable that the largest demand for electricity is during the coldest months of the year, and this consumption is double if compared with the one in summer. Furthermore, the largest proportion of power consumed by English families, 52,5%, is used to heat rooms and water.

The daily consumption of electricity during winter fluctuates between 30000 units in morning hours and 45000 units in the evening. On the other hand, the demand in summer is much lower an less variable, with figures between 13000 units in the morning and 20000 units in the early afternoon. Moreover, both in winter and summer electricity consumption has its bottom between 6 a.m. and 9 p.m..

Looking at the pie chart, the remaining 50% of power consumed is equally distributed in three slices. Almost 18% of that is used for ovens, kettles and washing machines, while 15% is consumed for lighting, televisions and radios. The other 15% is utilized for vacuum cleaners, food mixers and electric tools.

Any comments are appreciated. Thanks


Traveler   
Sep 25, 2013
Writing Feedback / IETLS Proportion of population aged 65 & over; Aging will accelerate after 2030s [3]

The proportion of USA will increase from 9 percent to 24 percent in that period. Sweden will increase from 8 percent to 25 percent and Japan will increase from 5 percent to 27 percent.

In your overview paragraph avoid giving details (you'll keep those for the next paragraphs), just describe the main trends and important things (in this case, for example, mention that Japan will have a dramatic increase).

Be careful with the tense, when you talk about the future, use the future; when you talk about the past, use the past.

Hope it helps
Traveler   
Sep 27, 2013
Writing Feedback / IELTS: different levels of post-school qualifications in australia in 1999 [NEW]

The chart below shows the different levels of post-school qualifications in Australia and the proportion of men and women who held them in 1999.Summarise the information by selecting and reporting the main features, and make comparisons where relevant.

This is my answer


The bar chart compares five different types of higher education qualifications and the percentage of Australian men and women who had them in the year 1999.

At first glance we can see that skilled vocational diplomas were far more popular among males than females, while undergraduate diplomas were more common between women. On the other hand, almost the same proportion of men and women held a Bachelor's degree in 1999.

Around 70% of postgraduate diploma holders were males, whereas 30% were females. Moreover, a higher proportion of men than women (60% and 40% respectively) held a Master's degree in 1999. By contrast, 70% of those who held an undergraduate diploma were women.

Only 10% of skilled vocational diploma holders were females, compared to a ninefold figure for males, at around 90%. On the contrary, the smallest gender difference is at the Bachelor's degree level, where men and women accounted for approximately 50% each.

Any comments are appreciated. Thanks


Traveler   
Oct 2, 2013
Writing Feedback / IELTS TASK 1 THE GRAPH SHOWS THE PERCENTAGE OF UK ADOLESCENTS FOLLOWING A VEGETARIAN DIET [5]

Hi, your essay failed to reach 150 words, however with only one line in the graph it's difficult to write more than that! I suggest you to move the last sentence just after the introduction and to join it with the overview.

As can be seen from the chart, the amount of young people in the Uk who choose to eat a vegetarian diet increased gradually from 1960 to 2020.

I don't think you should use the past. You could say, for example: During this period of time, the proportion of UK teenagers who decided to follow a vegetarian diet increases.

Hope you find it useful.
Traveler   
Oct 5, 2013
Writing Feedback / IELTS WRITING TASK 1:Bar graph/ Asian Elephants [3]

in the both of years

I think it's better say: in both years.

while in other countries there were fluctuation in numbers.

while figures for the other countries fluctuated.

In 1997 in India elephants number reached to a peak of about 9900 elephants

In 1997, the number of elephants in India peaked at around 10000.

Coming next

I suggest you to use a different word/linker.

Hope this helps
Traveler   
Oct 5, 2013
Writing Feedback / IELTS-CAM4-TRAVEL TO AND FROM THE UK AND MOST POPULAR COUNTRIES FOR UK RESIDENTS [4]

The charts below give information about travel to and from the UK, and about the most popular countries for UK residents to visit. Summarise the information by selecting and reporting the main features and make comparisons where relevant. Write at least 150 words

This is my answer

The line graph illustrates how many people travelled to and from the UK over a period of 20 years. The bar chart provides information about the most visited countries by UK residents in 1999.

It is noticeable that between 1979 and 1999 visits to and from the UK both increased, but the latter rose the most. Additionally, European countries such as France and Spain were among the most preferred by UK citizens.

In 1979, around 13 million UK tourists travelled abroad, while 10 million overseas residents visited the UK. Over the next 20 years, the number of people travelling to and from the UK rose. However, while the former reached approximately 25 million in 1999, the latter experienced a twofold increase, reaching around 50 million in the same year.

Looking at the bar chart, France and Spain were visited by 11 million and 9 million British people respectively. On the other hand, Greece and Turkey were the least popular countries, with only 3 million and 2 million UK visitors respectively. The figure for the USA was slightly higher, at around 3.5 million.

I have a couple of questions:
1 - In this phrase: "visits to and from the UK both increased, but the latter rose the most". Is it an error to put "both" before increased? Does it sound better without it?

2 - Another thing, "but the latter rose the most" Is it ok? or is it better to say: but the latter experienced a higher rise?

Any other comment is appreciated. Thanks.


Traveler   
Oct 12, 2013
Writing Feedback / IELTS WRITING TASK 1: THE TABLE/ Actual Vs Estimated house construction [5]

Hi, try to change a little bit your introduction, it's very similar to the question itself. If you just copy it, you will lose marks.

Overall, the actual numbers of houses built in Britain were higher than the estimated ones.

I suggest you to write another sentence to make your overview paragraph more complete (for example instead of your sentence you can say that "in almost all regions actual figures were higher than the estimated ones. England had the biggest difference compared with other regions.

Hope it helps.
Traveler   
Oct 31, 2013
Writing Feedback / IELTS; GRAPH - evolving trend of population aged 65 and over [3]

Hi, I suggest you to change a little bit the organization of your details paragraphs. Try to make one paragraph in which you compare the figures for all the countries in 1940, then you can say what happened during the following decades. In your last paragraph say what are the predictions for the year 2040.

Hope it helps
Traveler   
Oct 31, 2013
Writing Feedback / IELTS - the largest percentage of consumer spending in each country went on food/drinks/tobacco [3]

The table below gives information on consumer spending on different items in five different countries in 2002. Summarise the information by selecting and reporting the main features, and make comparisons where relavant. Write at least 150 words

This is my answer

The table illustrates the proportion of money spent by consumers on three different categories of goods and services in five countries in 2002.

It is noticeable that the largest percentage of consumer spending in each country went on food/drinks/tobacco, while the lowest on leisure/education. Furthermore, Turkey and Ireland were the countries with the highest overall proportion of expenditure.

In 2002, spending on food, drinks and tobacco was particularly higher in Turkey and Ireland, at around 32% and 29% respectively. By contrast, the corresponding figure for Sweden was much lower, at nearly 16%. In addition, Sweden had also the lowest percentage of consumer expenditure for the clothing/footwear category, at 5.40%.

The table also shows that the highest proportion of spending on leisure/education was in Turkey, at 4.35%, whereas the lowest was in Spain, at only 2%. On the other hand, Italy had a significantly higher percentage of consumer expenditure for clothing/footwear, at 9%.

Any comment is appreciated. Thanks.


Traveler   
Nov 1, 2013
Writing Feedback / IELTS 1; DIAGRAMS; Island before and after construction [3]

Hi, here are my suggestions.

The graph contains

The maps(diagrams) illustrate

about a transformation an empty land into the recreation area

about the development of an island into a tourist attraction.

I suggest you to reorganize the paragraphs following this structure: 1-Introduction 2-overview 3-details 4-details. According to this scheme the sentence

The island experienced significant changes and turned into a modern tourist resort.

is part of the overview paragraph along with

Before the construction there was an empty space surrounded by sea with a beach and only a few palms on the island.

Hope it helps
Traveler   
Nov 6, 2013
Writing Feedback / bar graph task 1 spending money on entertainment [9]

Hi,

The bar graph illustrates us the expenditure of money on various kinds of amusing facilities from 1995 to 2000.

The bar graph illustrates the expenditure on various kinds/types of entertainment/amusement in three different regions from 1995 to 2000. I think that "expenditure of money" is redundant.

Overall, from the given bar chart it is obviously that in certain regions people spent on several recreational activities more money than the others. But in all of them the most significant level of financial quantity belonged to such forms as Publishing and Television.

I suggest you to put the overview paragraph right after the introduction and to modify it. You could say the two major points, (e.g. that US had the highest spending on entertainment during the period shown, while Asia had the lowest). The second point (which you actually mentioned) is that television and publishing were the forms of entertainment with the largest amount of expenditure in each region.

Then, you can write 2 paragraphs in which you give the details and make comparisons.

Hope this helps
Traveler   
Nov 7, 2013
Writing Feedback / IELTS-CAM 9-TASK 1-ISLAND BEFORE AND AFTER THE CONSTRUCTION OF TOURIST FACILITIES [4]

The two maps below show an island, before and after the construction of some tourist facilities. Summarise the information by selecting and reporting the main features, and make comparisons where relevant. Write at least 150 words.

This is my answer

The maps illustrate the changes to an island after the development of tourism infrastructure.

It is clear that the island has changed significantly after the introduction of tourism. Before the development took place there were only some palm trees and a beach, while now there are facilities and attractions available for tourists.

Looking at the second map, the access to the island was made possible through the construction of a pier on the south coast, which is connected to the reception by a vehicle track. This road also links the reception to the restaurant, on the north side of the island, where guests can eat.

Visitors stay in huts located in both the centre and the west side of the island, with each hut connected to others by means of footpaths. Tourists can now enjoy themselves with activities such as swimming at the beach on the west coast, and sailing in the south sea.

Any comment is appreciated. Thanks.


Traveler   
Nov 10, 2013
Writing Feedback / Given is a bar chart illustrating the amount of rice production in ten top nations in 1999 [9]

An important thing I want to make you notice is that the graph describes something happened in the past, so you should use past tense. Another thing, there is no need to say the exact figure, just say for example "almost 193,000" instead of 192,971.

It is interesting to note that the country with the highest population in the world is also the highest of rice production

. major producer of rice, with almost 193000 tons .

Actually, from information provided by bar chart, China is the biggest of the amount rice producing in 1999 ,
reaching approximately 192.971 thousands of tons.

You already mentioned in the previous sentence, so i deleted this part, you can simply add the number at the end of the previous sentence (see above).

By contrast, the rice producing of both nations America and Philippines respectively are considerably smaller.

amounts of rice produced by the USA and Philippines are considerably smaller

The former reaches mere 8.183 thousands of tons and the latt er only 10 millions of tons.
While the production of Japan is a little higher, at nearly 12 millions of tons.

Hope it helps
Writing
Editing Help?
Fill in one of the forms below to get professional help with your assignments:

Graduate Writing / Editing:
GraduateWriter form ◳

Best Essay Service:
CustomPapers form ◳

Excellence in Editing:
Rose Editing ◳

AI-Paper Rewriting:
Robot Rewrite ◳