Unanswered [14] | Urgent [0]
  

Posts by joythblessy
Joined: Sep 24, 2012
Last Post: Nov 30, 2013
Threads: 86
Posts: 272  
Likes: 15
From: India

Displayed posts: 358 / page 2 of 9
sort: Latest first   Oldest first  | 
joythblessy   
Feb 17, 2013
Writing Feedback / Nowadays for many people the Internet is replacing regular books. [6]

Hai william...

You have some good points but it didn't come out in a nice way..

Your introduction..

Address the question..
Give your opinion if prompt asked to give...
In your introduction i didn't see a clear opinion..(.
This part i don't think there is need of writing an example..

2nd..
What will happened in the future..
It is better to mention in future, e-books will be popular, libaries...
Well...these points you should organise under this question...

Next...

What is your opinion about this trend...
Last body para you have points to answer this question..
Organise it well.

In conclution..
You should restate..
The answers of all the question, in very short..

So you need organisation of the answers..

In the starting i thought you are supporting e-book trand, towards last i feel you dodn't like this trend. But finally...):

Be careful about the questions...
Tessy
joythblessy   
Feb 17, 2013
Writing Feedback / Education plays a pivotal role; Children learn how to be good members of society [4]

Hai william..

I like your essay...
good flow..

Structure also is good..

Yes, it is disscussion type question. In this type you should give your opinion (if the prompt asked your opinion) in the introduction.in conclusion, you should restate your opinion..

I think you followed the desired structure...):
Good luck..

Tessy
joythblessy   
Feb 17, 2013
Writing Feedback / ( IELTS graph) Demand for electricity in England during Winter & Summer [5]

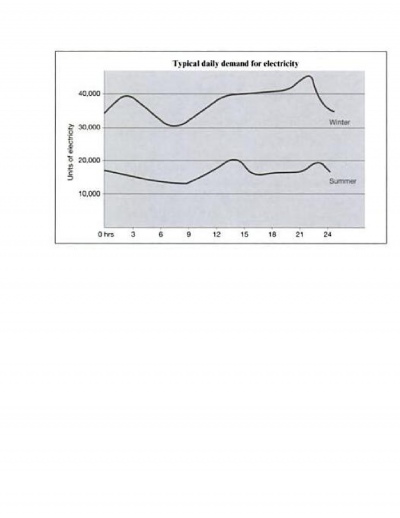
The graph below shows the demand for electricity in England during typical days in winter and summer. (Cambridge IELTS 4, page 54)

The given illustrates the consumption of electricity during winter and summer for 24hrs in England. The minimum amount of electricity used during summer is at 9 pm, and minimum is 20000units and 12 to 15hrs. The highest use in winter is between 21 to 23hrs, 48000units, and minimum is between 6 to 9hrs, 30000unit. The consumption of electricity is more in winter than in summer.

To begin with, during summer, 18000units of electricity is used at 0hrs which is gradually dropped and reached to the minimum of 12000units at 9am. The following 4hrs the consumption of electricity showed a sharp increase and touched the peak level between 13 to 15 hrs. The next two hours the demand decreased and remained in the constant level roughly, until 21hr, 26000units. The next one hour it gained the second highest level of consumption just below 20000units and then dropped.

During wintertime, the use of electricity is raised sharply until 3hrs and reached below 40000units followed by a sharp drop in the next four hours. It reached the minimum level between 6 to 9hrs, thereafter, the rate shooted. At 14hrs it reached to 40000units and remained constant for the next 5 hours. It showed the maximum consumption between 21 to 22hrs, 48000units, then dropped to 35000 at 24hours.


joythblessy   
Feb 17, 2013
Writing Feedback / (IELTS essay) An ambition is positive or negative? [2]

Is ambition is a positive or negative characteristic? Is it necessary for success?

In many situations, an ambition is highly regarded. An ambition can show right path, help to work hard and achieve the dream. Although ambition has a dark side, I believe, within the limit, ambition is a driving force towards success.

To begin with, anything, which is in excess, is good for nothing. It is applicable to ambition also. Ambition is often associated with negative characteristics such as greed, intolerance, power and so on. To become a wealthy man within a short time, force people to resort unfair means to heap wealth. It is also linked with ruthlessness. An honest man cannot leave a blind eye on corruption, which otherwise provide him a huge sum of money as bribe. Additionally, it can block out human feelings such as friendship, compassion, respect for others, and may leave them solitary. For instance, people who wants power and money at any cost; neglect the needs of their friends, the reward will be often loneliness.

However, there are so many benefits of having a prompt ambition. Firstly, being ambitious means, understanding that we have abilities and we can become better. Proper plans help us to make out paths for success in our personal, family, or professional lives. For instance, an ambition of becoming a Doctor, make people to realize the skills need for it and work hard to fulfill it. Secondly, it teaches resilience. When problems arise, ambitious people find a way to overcome it. Thirdly, being ambitious make us adaptable and tolerant. To brake a record, one should word hard even in the bad climate. Lastly, a goal in good sense does not have to mean a solidarity end. It can be a vision for a city, the elimination of a disease, or the improvement of a community.

In short, ambition is often portrayed negatively. Without ambition, our lives become mechanical and meaningless. We need to create ambitions, and enjoy the better present and future. At the same time, we should not be over ambitious.
joythblessy   
Feb 17, 2013
Writing Feedback / ( IELTS essay)Difficult hobbies are more enjoyable? [6]

Hai Dumi, Dev, Somy and Dongguo..
Hai dumi..

Reading books gives physical rest and thereby physcical rest..(
Am i wrong..?

Thanks for your correction..

Hai Somy and Dev..
Thanks for your concern..

Hai Dongguo..
Thanks..

Tessy
joythblessy   
Feb 16, 2013
Writing Feedback / (IELTS graph)Brick making process; Graphical interpretation [4]

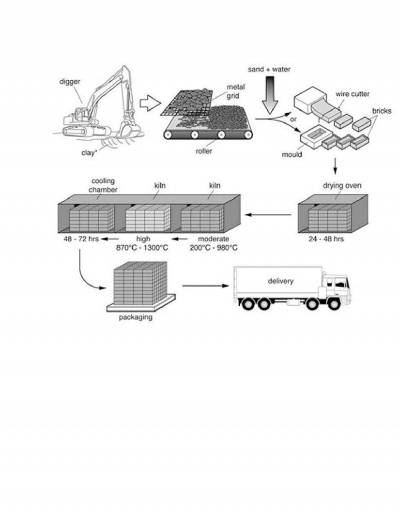
The given chart disrobes the process of making of bricks until transportation to the place of delivery. It consists of three steps, molding bricks from the clay, thermal processing and the delivery of the bricks.

To begin with, in the first step the clay is collected by a digger, and strained by passing it over a metal grid. This process removes big particles from the clay. The clay is kept on a roller and mix with water. This mixed clay is now ready for making bricks. The mixed clay is either pass through the squire box and the wire cutter is using to cut the bricks according to its size, or a mold is using to shape the mixed clay into bricks.

In the second stage, the molded bricks are shifting into the drying room and kept there for 24 to 48 hours. After that it is keeping in the kiln at a moderate temperature of 200 degree to 980 degree first, then high heat of 890 degree to 1300 degree, finally in the cooling the chamber for 48 to 72 hours. At the end of the process, the brick is ready for packing.

The final step consists of packing and delivery. Packed bricks are taken to the place of delivery in big transporting vehicle.
You should spend about 20 minutes on this task.

The diagram illustrates the process that is used to manufacture bricks for the building industry.
Summarize the information by selecting and reporting the main features and make comparisons where relevant.
Write at least 150 words.

The Brick Manufacturing Process


joythblessy   
Feb 16, 2013
Writing Feedback / (IELTS graph) Immigration, Emigration and Net migration in UK. [4]

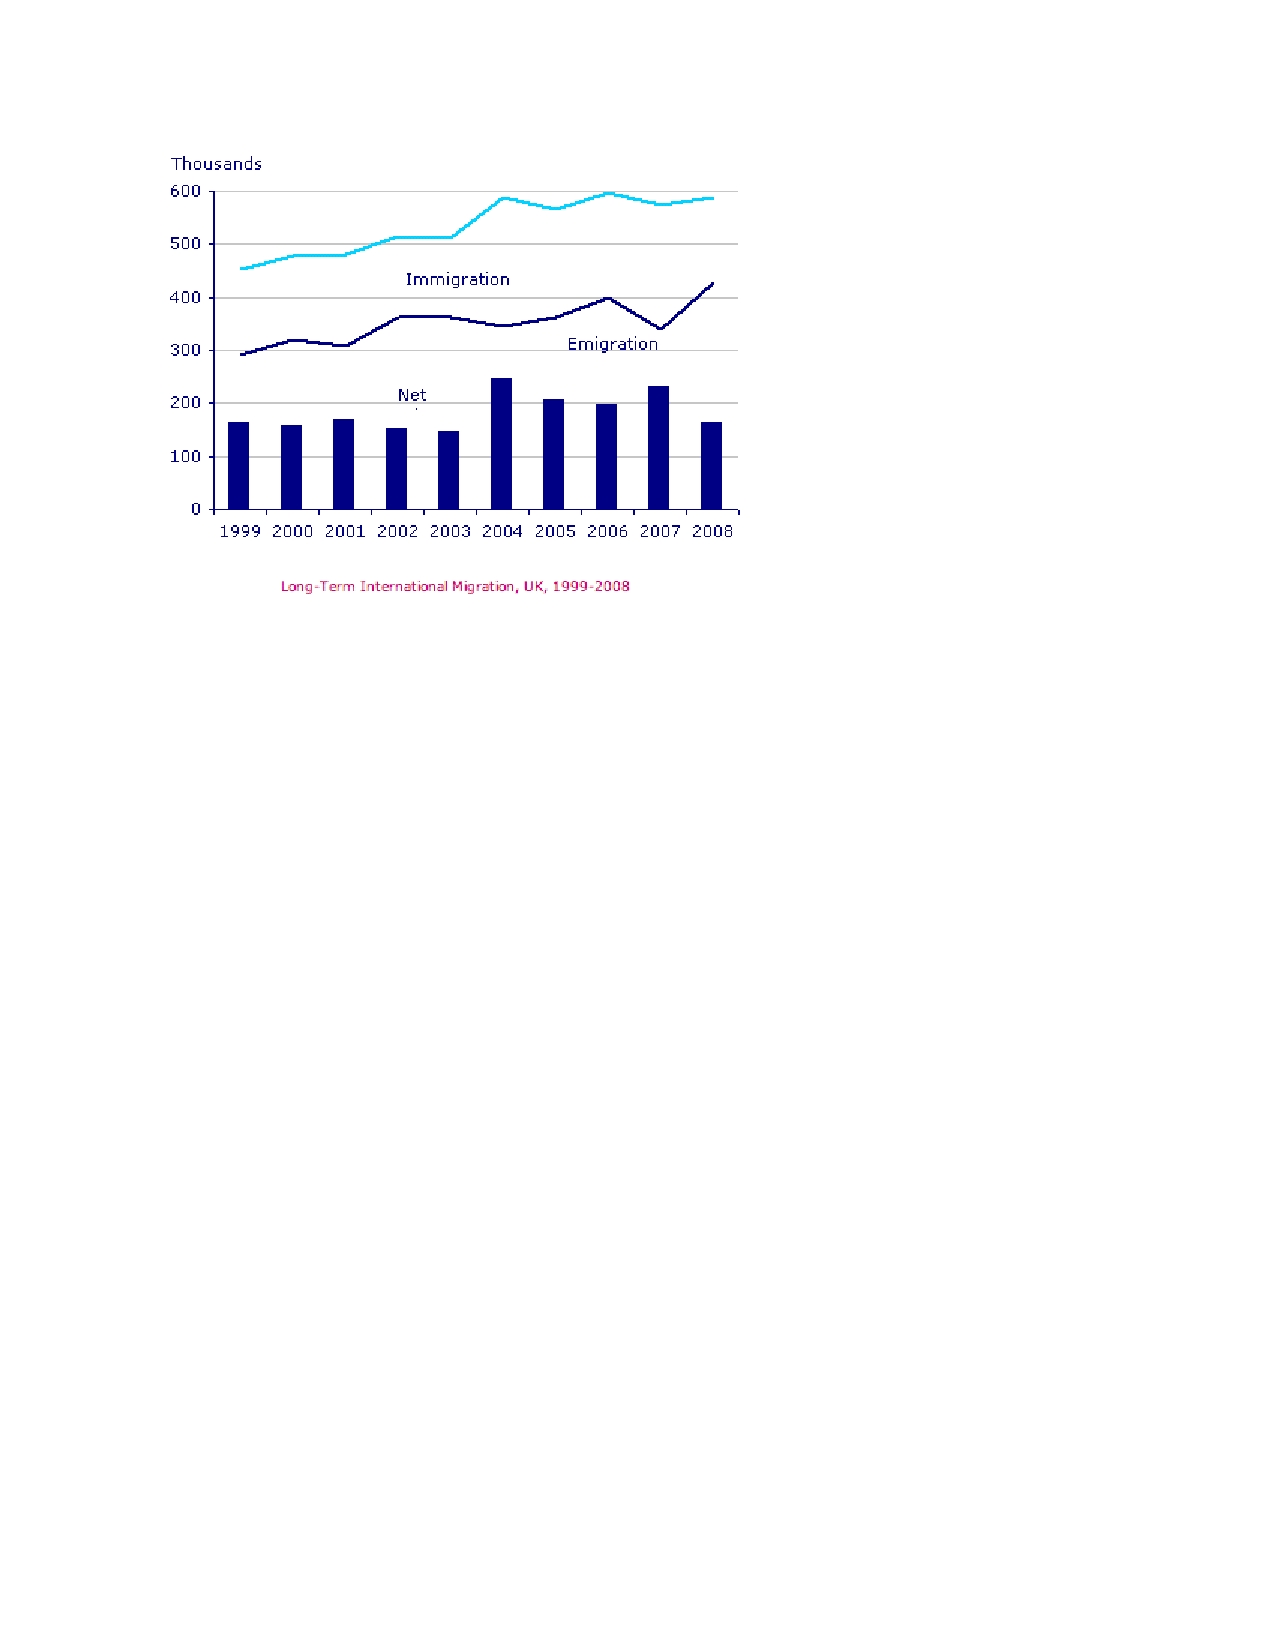
The given chart gives information about UK immigration, emigration and net migration over a period of 9 years from 1999 to 2008. During this time, the rate of emigration and migration showed increased where as net migration peaked at 2004 and 2007.

Turning to detail, the net migration rate stayed between 150,000 to 190,000 in1999 to 2003. In 2005, it reached to 200,000 and remains constant in the 2006. Though the year 2007, the rate of migration showed an increase nearly 220,000 at the end of the period it dropped to 180,000 which is same as the rate of 1999.

In case of the rate of migration, it started from 300,000 in the year 1999, shows negligible rise in 2000 and stayed roughly same in the three years following 1999. Then it increased and reached 380,000 thousand is the following year and remain steady for the year 2003, after a marginal gradual drop of 20,000 in the year 2004. However, in the next two years it raised continuously and touched at 400,000 in 2006. After a fall of 300,000 in the year 2007 it regained and peak at 2008 at the rate 2008 at the rate 420,000.

Immigration also shows increasing trend from 1999 to 2000, remained the same for the next year, and reached at just above 500,000 in 2003 a growth in 4 years. Then it increased significantly, reached just under 600,000, fluctuated between 680,000 and 600,000 in the following four years, and reached to just below 600 thousand in 2008.

In short, the net migration ended in 2008 at the same level as it started in 1999. Immigration and emigration shows an increase of nearly 150,000 in 9 years.

The given chart gives information about UK immigration, emigration and net migration over a period of 9 years from 1999 to 2008. During this time, the rate of emigration and migration showed increased where as net migration peaked at 2004 and 2007.


joythblessy   
Feb 14, 2013
Writing Feedback / (IELTS graph) Population of turtles in India [6]

hai Dumi and Pahan..

Hai dumi..

Thanks for the link you provided through Khof's thread. I was in search of that link which was skipped from me...):
Thanks for the guidence and support..

Hai pahan...
thanks for your correction..

Tessy
joythblessy   
Feb 14, 2013
Writing Feedback / In the past, buildings often reflected the culture of a society- IELTS [6]

Ha i Kurian...

The prompt asked about the reasons of alike buildings in the cities around the world. And it is good or bad...):
I feel the 2nd body para is offtopic....(:
you should explain the trend is positive or negative..

Reasons..
:need of more place for living and other activities..
:overpopulation cities..
:costy land price in cities (you mentioned)
:need of using every inch of space.

Tessy
joythblessy   
Feb 13, 2013
Writing Feedback / (IELTS graph) Proportion of people in household types living in poverty in Australia [2]

You should spend about 20 minutes on this task.
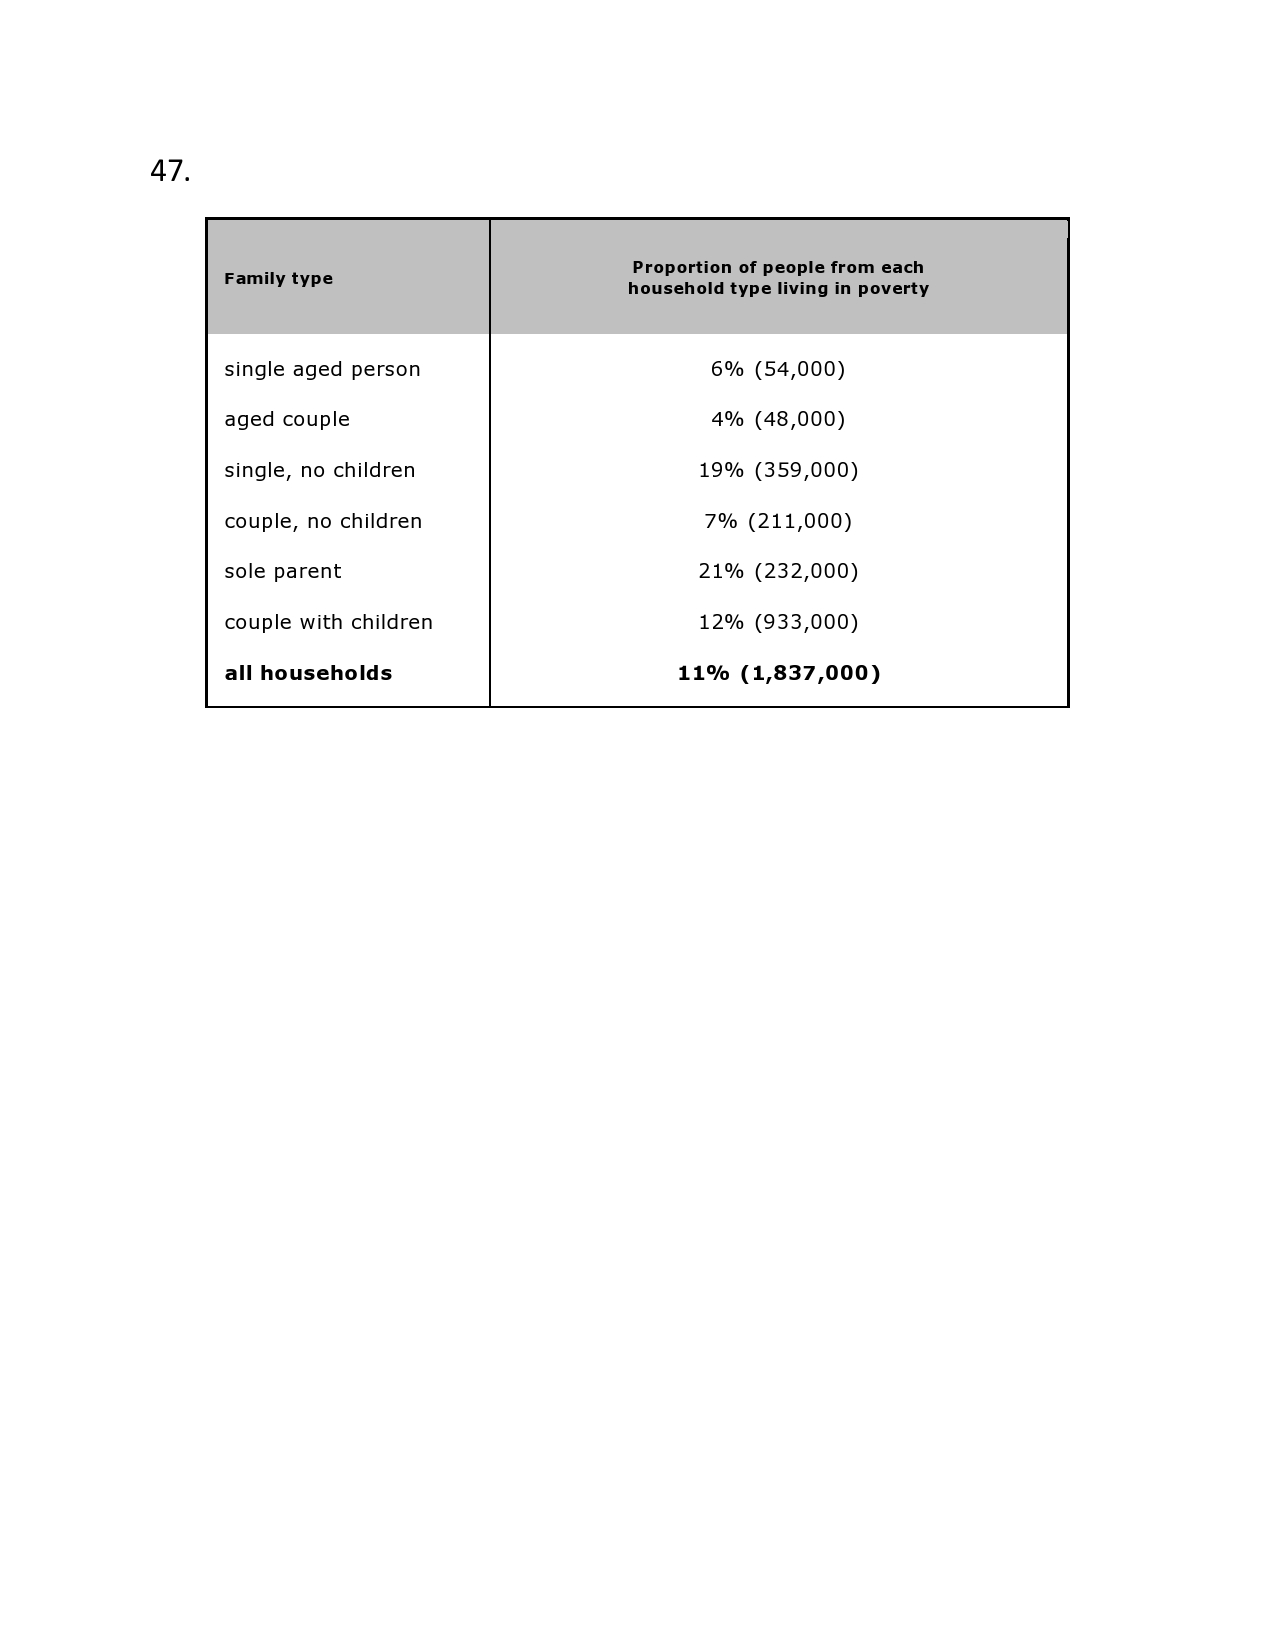
The table below shows the proportion of different categories of families living in poverty in Australia in 1999.

Summarise the information by selecting and reporting the main features, and make comparisons where relevant.

The given table chart gives information about the percentage of people in the six household types living in poverty in Australia and the percentage of all households.

From the chart it is clear that the single age person, aged couple, couples without children under poverty are below 10% , whereas childless single and couples with children ranged between 10-20% and sole parent under poverty is the highest, 21%.

Turning to detail, all household type living under poverty is 183700, which is 11% and is closely following the percentage of poor couple with children 12%, 933000. The difference in the percentage of the single aged person and couple under poverty is only 2%. Aged coupled couple, single aged couple and childless couple, which are 4%, 6%, and 7% respectively, share the first three places of lowest percentage of categories of poverty household types.

Couples with children is holding 12% which is double of single aged person that is three folds more than that of aged couple. Sole parent living under poverty have the highest proportion of household type living under poverty. This group is three folds the percentage of the childless couple, and seven folds of the aged group that is the least proportion of the people under poverty.

In short, aged couple, which is 4% (48000), is the least proportion of people living under poverty, while, sole parents with 21% (232000) is the highest proportion of people living under poverty.

The table below shows the proportion of different categories of families living in poverty in Australia in 1999.

Summarise the information by selecting and reporting the main features, and make comparisons where relevant.


joythblessy   
Feb 12, 2013
Writing Feedback / (IELTS graph) Population of turtles in India [6]

hai Ahmad...

Thanks a lot for your concern and guidence..
I have not much idea about how to write a graph..

I feel this may be the reason of my less score....(Ř›

Thank you so much once again for your help...

Tessy
joythblessy   
Feb 12, 2013
Writing Feedback / (IELTS graph) Population of turtles in India [6]

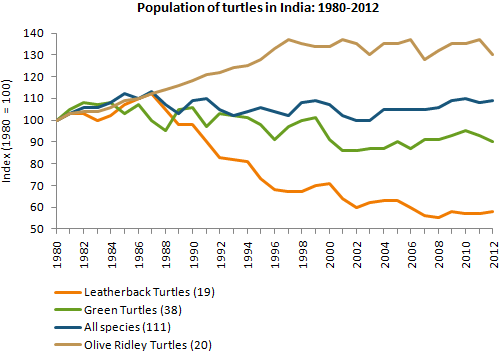
The given bar chart gives the information about the population of turtles in India between the years from 1980 to 2012, which include Leatherblack Turtles, green turtles, Olive Ridley and all species.

From the graph it is clear that, all categories of turtles were only 100 in 1980. It showed significant growth and falls during all these 22 yrs. All given categories of turtles population increased with marginal drop still 1984. Thereafter, up to 1999 all categories decreased except Olive Ridley. Green turtles had succeeded in maintaining their population between 90-100, while the population of all species stayed between 100-110 between the years 1998 to 2012.

Though, Olive Ridley turtles has shown a significant sharp growth in their population up to 1997, the following years it displayed a fluctuation in their population. It maintained the level of 130-120 from the years 1996 to 2012. On the contrary, Letherback turtles showed a continuous decrease with marginal increase and decrease, and reached the level of 60 in 1012 from 110 in the year 1987.

In short, all species and green turtles remain constant roughly over the period of last decade with minimal deviations. Latherback turtles has showed a downward trend in their population, while Olive Ridley turtles has increased the population and maintain the average population between the years 1996-2012.


  • graph
joythblessy   
Feb 12, 2013
Writing Feedback / (IELTS graph)Time duration and Severity of acid production by three sweet products. [2]

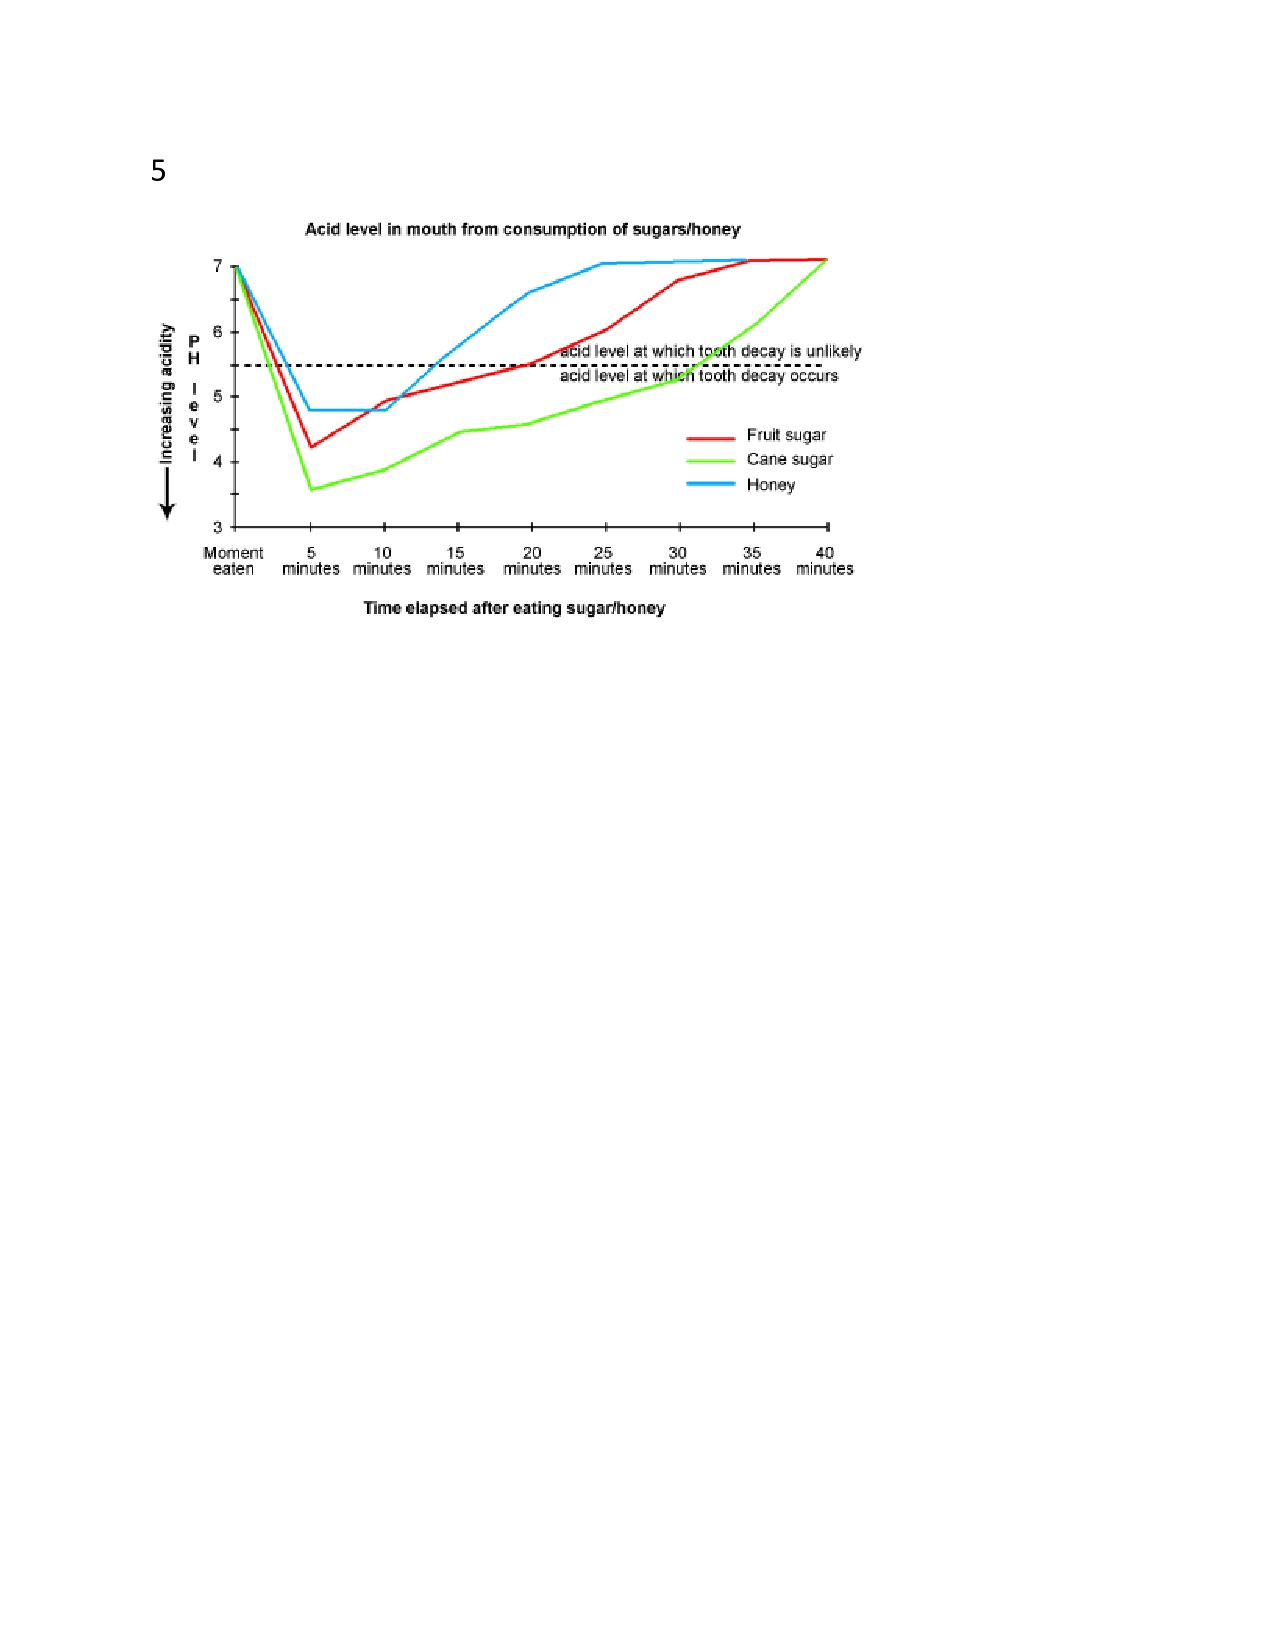
You should spend about 20 minutes on this task.
Eating sweet foods produces acid in the mouth, which can cause tooth decay. (High acid levels are measured by low pH values)

Describe the information below and discuss the implications for dental health.
You should write at least 150 words.

The given chart illustrates the possibility of dental problem with the time elapsed after the consumption of fruit sugar, honey, and sugar cane.

It is clear from the data that the intakes of sweet products produce acid in the mouth and thereby reduce the ph. Low level of acid increase the chance of dental problems especially when it is below 5.5. Sugar cane intake shows the highest risk of dental problems and honey is the lowest.

When comparing the three products, sugar cane, honey and fruit sugar the acidity sugar cane shows the highest increase of acidity and prolonged period of stay. The minimum risk of dental decay and the shortest period of risk are by honey. All these products shows the highest acid level and lowest of pH after five minutes of consumption, though the level of pH various 3.5, 4.25, 4.45 by sugar cane, fruit sugar, and honey respectively.

The risk time also differs in these three products, which refers the risk time of dental decay. In case of sugar cane it is 30 minutes, fruit sugar it is 20 minutes and honey 12 minutes. sugar cane double riskier than honey.

The implication of dental health is that we should take care of the dental decay due the ingredients of these products. Sugar cane is the riskiest and honey is the safest while considering the duration and level of acid production, which are the indicators of the severity of risk of dental problems.

Eating sweet foods produces acid in the mouth, which can cause tooth decay. (High acid levels are measured by low pH values)

Describe the information below and discuss the implications for dental health.


joythblessy   
Feb 12, 2013
Writing Feedback / IELTS Task2 ; "that all students should learn a foreign language" [4]

hai...

You have good points

I feel the part which you oppose the idea is little bit weak..

:somany people feel it is an overburden for the small children.

: it force them to spend more time in their studies and thei time for play will reduce. Which is important for the children.

All the best

Tessy
joythblessy   
Feb 11, 2013
Writing Feedback / ( IELTS essay) Who is more influential in children: Parents or Classmates [3]

Do you agree with the following statement? Classmates are more important influence than parents on child's future..?

In this ever-changing fast world, children get effected by both classmates and their parents. It is a debatable topic, whether classmates or parents are more powerful in childrens' lives. However, I feel, they are more influenced by their classmates.

To begin with, nowadays, parents are not spending enough time with their children because of their busy life schedule. Young children are spending quantity time with their friends than parents, and are more involved with them, so the influence of friends on them are very strong. Students usually spend their time in school, part-time jobs, studies, plays and just having fun with friends. These activities take more time to interact more with their friends. For instance, when I was in the school I used to share my ideas and experiences with my classmates, who are in the same age with different experiences.

Secondly, young adults are in a transient stage of personality. In that age, they are trying to imitate others. They want to catch the eye of others and blindly follow whoever succeeded and got attraction from others. Parents restrict them from some activities for their bright future or to avoid facing dangers in life while, classmates support them in all. Besides, they try to live independently and these young adults neglect parents' opinions and accept the opinion of their friends. Moreover, children are choosing their own friends but cannot select their parents, and forced to accept them.

In conclusion, children are spending quantity time with their friends and feel that, classmates are more attached to them. As a result, I believe, children get affected from their friends more than their parents get.
joythblessy   
Feb 11, 2013
Writing Feedback / IELTS-Some people think the role of women in military or police forces is relevant [6]

Hai Dev...

Multi tasking in their tasks...?

aditional points..

The service of women in help to handle female offenders in a betterway.

:they can understand womens' problems and tackle them more effectively.

:women proved their brillience and excellence in all fields and military is not an excemption.

Tessy
joythblessy   
Feb 11, 2013
Writing Feedback / IELTS-Rare languages disappear from the world. Some people say is not important [5]

Hai dev..

Additional points...

:Disapearing unwritten languages make scientists to trace aboriginal cultures..
:more people may infuenced by shallow media of agressive politions, if more people use a language

Other side..

:promotes unity, equality and economis developments.
: reduces the need of translation, misunderstandings and boost business.

Tessy.
joythblessy   
Feb 11, 2013
Writing Feedback / There was a gradual slight drop in the sales of CDs during this three years period (2000-2003) [5]

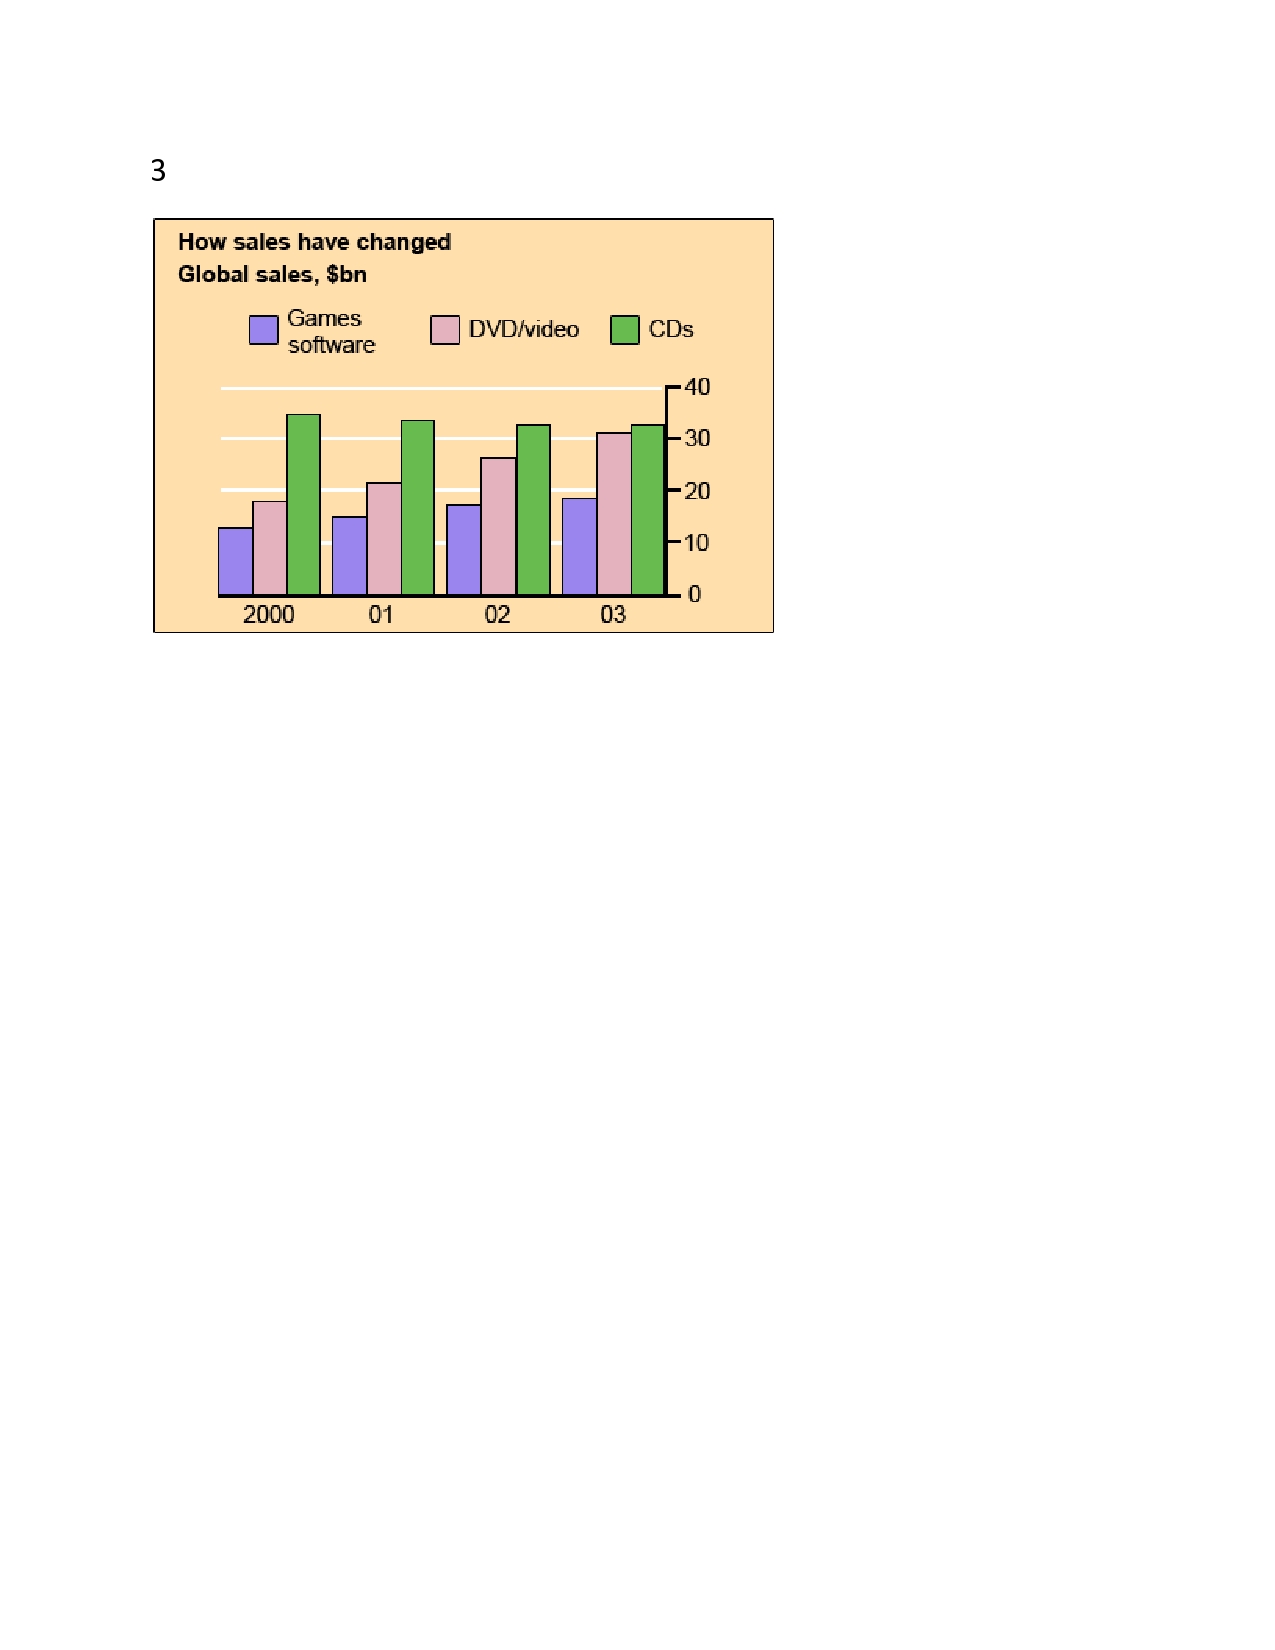
The chart below gives information about global sales of games software, CDs and DVD or video.
Write a report for a university lecturer describing the information.
- You should write at least 150 words.
You should spend about 20 minutes on this task.


The given bar chart illustrates the changes in the global sales of game software, DVD/Video and CDs between the three years of 2000 to 2003.

There was a gradual slight drop in the sales of CDs during this three years period. In 2000, it was 35 billion dollars, reached to 31billion dollars in 2003. In case of games software, there was a slight continuous increase in the sales. In 2000, it was 12 billion dollars, which touched to 19 billion dollars in 2003, an increase of 7 billion dollars after three years. In the same period, the sales of CDs showed a significant increase without any drop. In 2000, it was 18 billion dollars reached at the peak of just above 30 billion dollars in 2003.

The sale of CDs was only one third of the sale of CDs in 2003, gained its popularity and became half of the sale of the CDs in 2003. The sale of the DVD/Video in 2000 was below half of the sale of the CDs in 2000, reached almost equal sale in 2003. There was a notable difference in the sale of these three items in 2001 and 2003.

In short, the popularity of the CDs is slowly decreased, while the DVD/Video increased remarkably in the whole world.

The chart below gives information about global sales of games software, CDs and DVD or video.
Write a report for a university lecturer describing the information.


joythblessy   
Feb 9, 2013
Writing Feedback / (IELTS graph) Coca-Cola consumption and its share value [3]

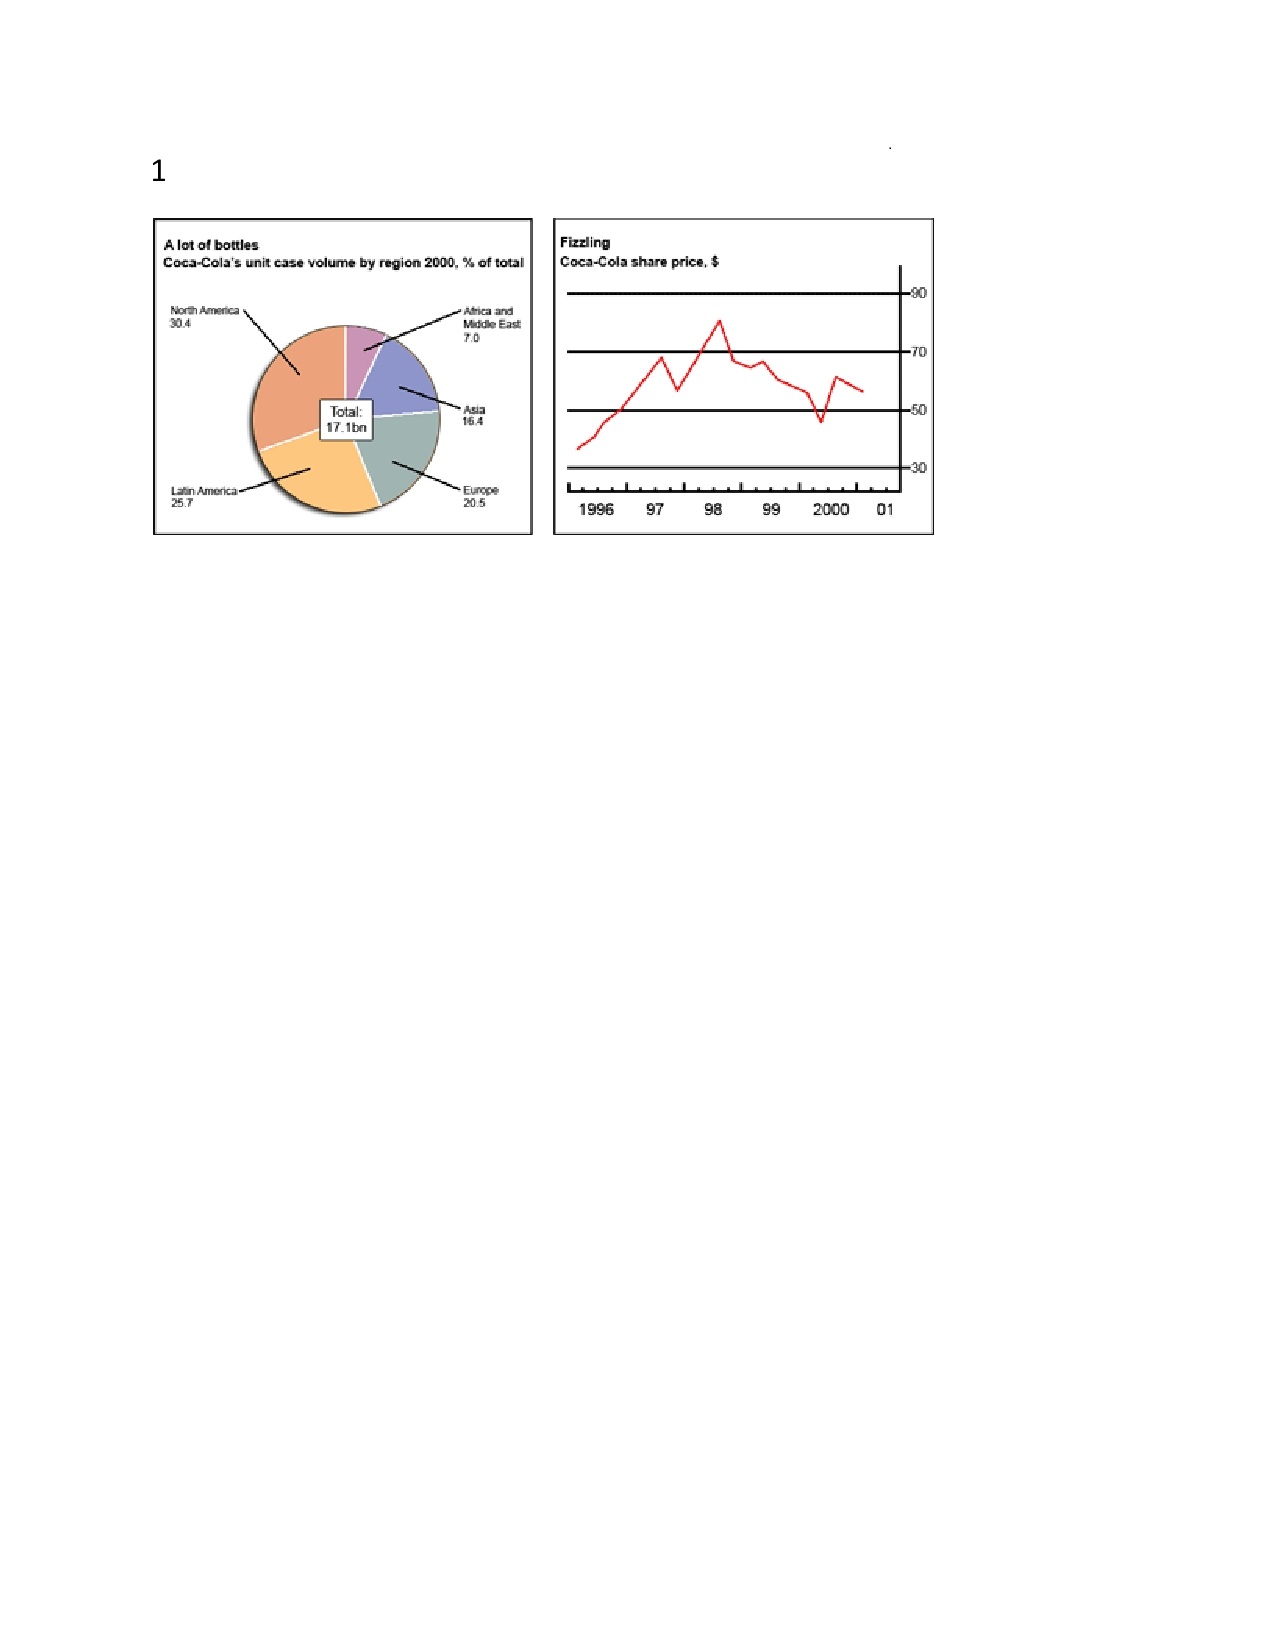
The chart and graph below give information about sales and share prices for Coca-Cola.
Write a report for a university lecturer describing the information shown below.
- You should write at least 150 words.
- You should spend about 20 minutes on this task.

The given pie chart gives the information about the sales of coca-cola in different countries in the year 2000. The line graph describes the share price of coca-cola from 1996 to 2001 in dollars.

From the pie chart it clear that, from the total consumption of 17.lbn, north America contributes 30.4% which was the highest among the five countries, followed by Latin America which was 25.7%. The difference between the two was nearly 5% only. Asia and Europe used 16.4% and 20.5% respectively and there was only 4% difference. Africa and Middle east consumed only 7.0% of the total coca-cola use.

The line graph clearly indicates the fluctuation in the share values of the coca-cola from 1996 to 2001. The value was least at 1996, which was nearly 35$ in 1996. It shoot up and reached nearly 70$ in the second quarter of 1997. Though it dropped in the following six months, it regained its value in the next nine months. The share price rocked during this period and reached the highest level of 80$ in the second quarter of 1998. Thereafter, the following two years, it shows significant fall in the share value with minimum fluctuation and touched the level below 50$ in the second quarter of 2000. During the next two months the value rose sharply and gained the level of 60$ in the third quarter of 2000, followed by a slight drop during the first quarter of 2001.

In short, America, both North and Latin are the highest consumers of coca-cola respectively, while Middle east and the Africa are the least. The share value of the coca-cola was at the peak during the second quarter of 1996 and least was at 1996.


joythblessy   
Feb 9, 2013
Writing Feedback / (IELTS graph)Pie chart: Comparison of household expenses between the yrs 2010 & 1950 [2]

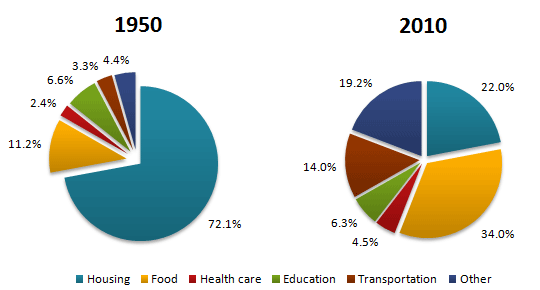
The pie charts below show the average household expenditures in a country in 1950 and 2010.

Summarise the information by selecting and reporting the main features, and make comparisons where relevant.
Write at least 150 words.

The given pie charts compares the differences between the average household expenditure in the year 1950 and 2010.
There is a significant difference between the given two years expenditure. In 1950 the major part of the spending was done on housing which is near to three quarter of the total expense. Below 10% of the total expense was done on three categories, which include health care 2.2%, transportation 3.3%, and others 4.4%. For education needed only 6.6% of the total average expenses.

On the contrary, in 2010 the highest portion of the average expense was done for food, which is 34%, followed by housing 22%. If comparing with 1950, the spending for others and transportation are increased by more than four folds, while education expenses remain roughly the same. Health care needs doubled.

In short, the important needs in 1950 was housing which was shifted to the second position in 2010. There are not huge differences between the average expenses of food and education and education and transportation in 2010.

Average Household Expenditures by Major Category


joythblessy   
Feb 8, 2013
Writing Feedback / ( IELTS essay) Advertisements promotes Quality or Quantity? [6]

hai..Dumi, Dev, Romeo, and syed...

Hai dumi..
Thnaks for your support..and correction..

Hai syed..

Thanks for the detailed explanation, your concern and time..

Hai Dev and Romeo..

Thanks for the help...

Tessy
joythblessy   
Feb 8, 2013
Writing Feedback / IELTS-News is a source of knowledge about the world. How much we trust the journalist [3]

Hai Dev..

You have some good points..
I feel it didn't came out nicely...

The examples in the 1st body para..
Disasters do you mean it is related to climate..?
I think journalists are not doing any research for weather forcasting they are telecasting the reports from the concerned department...):

Ipod...
It includes in the advertisment section know...(:

Be careful in choosing examples,,

Tessy..
joythblessy   
Feb 8, 2013
Writing Feedback / Graph:leisure activities compassion :pie chart [4]

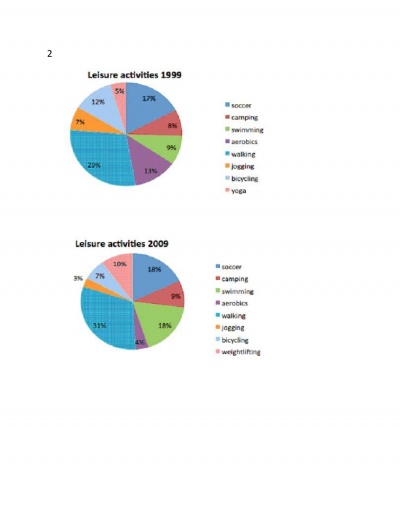
The following pie charts show the results of a survey into the most popular leisure activities in the United States of America in 1999 and 2009.Summaries the information by selecting and reporting the main features, and make comparisons where relevant.

The given two pie charts compares the popularity of leisure activities during the year 1999 and 2009 in America.

In 1999 there was very negligible difference between the percentage of yoga, jogging, camping and swimming. All shows below 10% popularity. The most popular leisure activity was walking which was 29% in the year 1999, increased to 31% after a decade.

The importance of aerobic exercises are decreased to one third after 10 years. In 1999 it was 13% reached to 4% in 2009. Soccer remained the same level roughly after the given period. Bicycle use as leisure activity fall from 12% in 1999 to 7% in 2009. Swimming became the favorable leisure activity and it doubled.

In short, in 2009, jogging dropped to half in 2009 and remained as the least popular free time activity. Yoga is replaced by weight lifting. Walking gained more importance. Soccer and swimming became second popular leisure activity.


joythblessy   
Feb 8, 2013
Writing Feedback / Graph: Water cycle - the continuous movement of water on, above and below (IELTS) [3]

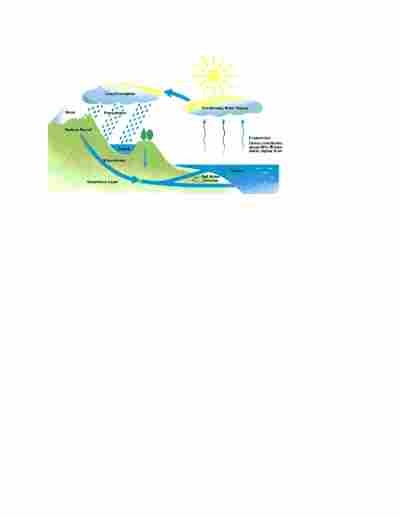
The diagram below shows the water cycle, which is the continuous movement of water on, above and below the surface of the Earth.

The given arrow diagram describes the water cycle above and below the earth.

The chart illustrate the water cycle as a continuous process in three stages such as evaporation of water from the sea, rain fall, and back flow of water to the sea.

In the first stage, due to the heat from the sunrays sea water evaporates which contributes 80% the total water vapor in the air, eventually forming clouds, containing water vapor.

This water results in rain fall, water vapors formed as water drops fall in the earth surface. It is stored in the lakes, form snow and the third part flow back to the sea.

In the third step, the surface water after a rainfall go deep into the earth and became ground water. It moves to the impervious layer. The water penetrate from the surface of the earth also came to the impervious layer. This water finally fall in to the sea and the process continuous.

In short, the water cycle is a continuous process which helps to maintain the needs of water in the earth.


joythblessy   
Feb 8, 2013
Writing Feedback / Graph: Different levels of education in developing and developed nations. [7]

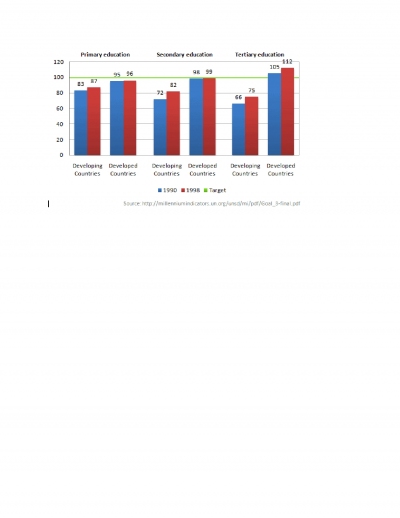
68 The chart below shows the number of girls per 100 boys enrolled in different levels of school education.

Write a short report for a university lecturer describing the information shown below.
You should write at least 150 words.

The given bar chart illustrates the number of girls per 100 boys enrolled in different levels of school education. This data is comparing the difference between developing and developed countries in the years 1990 and 1998 with the target of 100.

In cause of primary education, there was not much difference between the developing nations in 1990 and1998 and was below the target. In the same period, the developed countries also the number was roughly same, very close to the target.

At the same time, in case of secondary school education, developed nations roughly reached the target in 1990 and 1998 and both was around same. Developing nations, though they improved the number of girls in 1998they didn't came near to the target.

All nations showed improvements in the number of girls in the year 1998 compared to 1990. Developing nations never catch the target in 1990 or 1998, while developed came very close to the target and attain it in territory education.
joythblessy   
Feb 8, 2013
Writing Feedback / (IELTS essay) violent t.v reports to be banned? [4]

Television news shows many scenes of disasters and violence. What effect can this have on individuals and society? Is it necessary to ban reports including violence and disastrous scenes?

Television as a strong audio-visual media has a powerful impact both positive and negative on its viewers. Some people like to see a ban on these violent news broadcasts, while others consider it as a normal part of reporting news. However, I feel instead of banning, some regulations should be implemented for news broadcasts.

Younger generation love to watch violence and they find it thrilling. The teenagers, as less psychologically mature, watch them with interest, get influenced, tend to imitate these scenes and pick up flights in public places. Most importantly, media offers opportunities for potential criminals to be more skillful and dangerous. Those novices obtain essential information for committing crime without any loopholes, from these reports. These tricks enable them to operate the crime brilliantly, escape from being captured and penalized. Additionally, low enforcement has to put more effort to deal with these offenders.

Undeniably, news channels are usually reporting the real life incidents. It is true that, uncensored clippings related to calamities and terrorism has horrific effect on the viewers. Stress and hypertension are common while watching these types of reports. Besides, it makes a feeling of insecurity. Parents may impose restriction on their children and keep a strict vigil on them results in quarrel and misunderstandings among family members and friends. However, with stringent broadcasting law and censorships these adverse impacts can be reduced to an extent.

One the other hand, it has some positive effects also. These telecasts help us to know about the real depth of a these calamities or violence. 'As seeing is believing,' live pictures convey information in the way words cannot. Helping hands in the form of money, medicine and so on, help victims to relieve their sufferings to an extent. Furthermore, we become more conscious about our own security risks and implement more protection to our family members. It is an issue of freedom too. People have full right to know what is happening around as. Freedom of press is an inevitable part of a democratic government.

To conclude, there are both positive and negative impacts of media on people and society. It is unfavorable to impose ban on these reports but same regulations needed. We need to be stay informed. Along with censorship and strict broadcast laws, the viewers should decide what they want to see, instead of imposing ban on reports.
joythblessy   
Feb 6, 2013
Writing Feedback / IELTS-Design of newly constructed buildings in big cities controlled by government [4]

Hai Dev...
People from village...===> cities in search of better living standards.
:...construction unless it is REGULATED by...
:tow building...?
:... Which reduces the width of the roads...
:
Conclusion,
U started the essay with partcially agree, but conclusion it is end up with complete agree...(.

Be careful to restate your opinion in the conclusion.

You have some good points but it didn't came out in a good way....(.

Tessy
joythblessy   
Feb 3, 2013
Writing Feedback / ( IELTS essay) Mobile phones for children good or bad? [6]

Hai Dumi and Dev...

Hai Dumi...

Thanks for your correction, excellent encouragment and support...

I wrote camera in my draft. While typing i dropped camera....)p
Because, i thought it is mostly distracting students from their studies..

Thanks for your concern..

Hai Dev...

Thanks for the correction..

Tessy
joythblessy   
Feb 3, 2013
Writing Feedback / (IELTS essay) Dangerous sports banned or not; Children put themselves in trouble [5]

Hai dumi...

Thanks for your correction and suggestions..

So many people concerned about the time for my essays..By God's great grace i am compleating all my essays before timelimt. my limit is 35mints even....).

Before attemting the essays i managed the speed of my writing..so...no problem with time...).
Please tell me is there any problem except time in writing like this and including more ideas in my essays.

Thanks...
Tessy
joythblessy   
Feb 3, 2013
Writing Feedback / ( IELTS essay) Mobile phones for children good or bad? [6]

Many children these days have their own mobile phones. What are advantages and disadvantages? Give your own opinion.

In this high-tech fast world, undeniably, mobile phones became an inevitable part of everybody's life without any age limit. Although, it has lots of merits, in my point of view, the intense use of mobile phones among children may be discouraged because of its adverse impacts on them.

To begin with, mobile phones have numerous benefits. Presently, it is not merely a simple device, which allows an easy connectivity between people. It is supporting a number of other programs such as calculators, alarm clocks, voice recorder and so on. these programs boost their academic performances, if they use it cleverly. For instance, alarm clocks in mobile phones are useful for them to woke up early in the morning or adjust the time duration to write an essay. The easy accessibility of parents and friends make them comfortable and enable them to meet any emergency or unexpected conditions. Parents also will be much relaxed, as they know their children are safe.

On the other hand, these wonderful devices have negative sides also. Most importantly, the radiations from these devices are harmful for their developing brains. Researches proved that, these radiations might lead to cancers. The destruction of studies is another matter of concern. The games in the mobile phones create additions to children. Chatting and telephonic conversations with anonymous people may result in insurmountable impacts to their young minds. These contacts may indulge them in bad company and mafia especially drug and sex, spoil their future. Furthermore, easy connectivity to internet attracts them to unhealthy web sites and their total character may change. Additionally, children can effortlessly cheat their parents by convincing a false. To illustrate, if they are enjoying a television program at his friends home, they can make to believe their parents that they are on the way to their tuition class.

To conclude, mobile phones are beneficial devices, if we use it sensibly. Children, as they are not mature to handle it effectively, it may leave drastic disadvantages on them. Hence, I believe that mobile phones are not favorable for children, especially if it is used uncontrolled without proper guidance and time limit.

Writing
Editing Help?
Fill in one of the forms below to get professional help with your assignments:

Graduate Writing / Editing:
GraduateWriter form ◳

Best Essay Service:
CustomPapers form ◳

Excellence in Editing:
Rose Editing ◳

AI-Paper Rewriting:
Robot Rewrite ◳