Unanswered [6] | Urgent [0]
  

Posts by Eva Novita Sari
Name: Eva Novita Sari
Joined: Mar 25, 2014
Last Post: May 9, 2014
Threads: 47
Posts: 67  
From: Indonesia
School: Universitas Syiah Kuala

Displayed posts: 114 / page 2 of 3
sort: Latest first   Oldest first  | 
Eva Novita Sari   
Apr 29, 2014
Writing Feedback / 'monster if we cannot manage it well' - Movies or tv influence people's behavior [7]

How do movies or television influence people's behavior? Use reasons and specific examples to support your answer.
================================================================= =======================================

Television is a popular form of communication medium in any household. It has also becoming an important part in our daily life. It cannot be denied that television from which we get information and entertainments. It has contributed to the improvement of our society. But, on the country, I think television tends to have a tremendous influence on its viewers. In this essay I will give reasons about that.

Instead of advantages, the presence of television also affects negative on our society. Firstly, it is based on the recent research, all of people age are using this media to entertain themselves for an average of five hours a day. The content exposure of TV, of course, it will influence the viewers. It is not only their thinking but also attitude. Therefore, this can be seen from the fact that many criminalities are inspired from the scene of TV.

From other reasons, people can be adversely influenced by constant watching TV. They are less participate in physical and social activities, spend less time reading and working, and see a job of violence that can affect their feeling of security. For example, my friend is always watching television. Then, he becomes lazy for working because preoccupation.

In my opinion, television shows commercial advertisements on TV that can be a kind of advertising very bad for many children because they are not only sell product or advertise product, but they show their body too openly. This is not good for teenager, because it gives negative effect for them especially for their attitude. Therefore, television can be able to our on negative influence.

To sum up, it is clear that television will be a kind of monster if we cannot manage it well. It is very important for us to handle and manage the presence of television, especially for children and young generation.
Eva Novita Sari   
Apr 29, 2014
Writing Feedback / IELTS: Hydroelectric dam and turbine [5]

Hydroelectric dam wasis installed in the bottom of river. To take advantage of turbine in the river to produce the power for electricity.

:)
Eva Novita Sari   
Apr 28, 2014
Writing Feedback / IELTS:The stages and equipment used in the cement-making process [6]

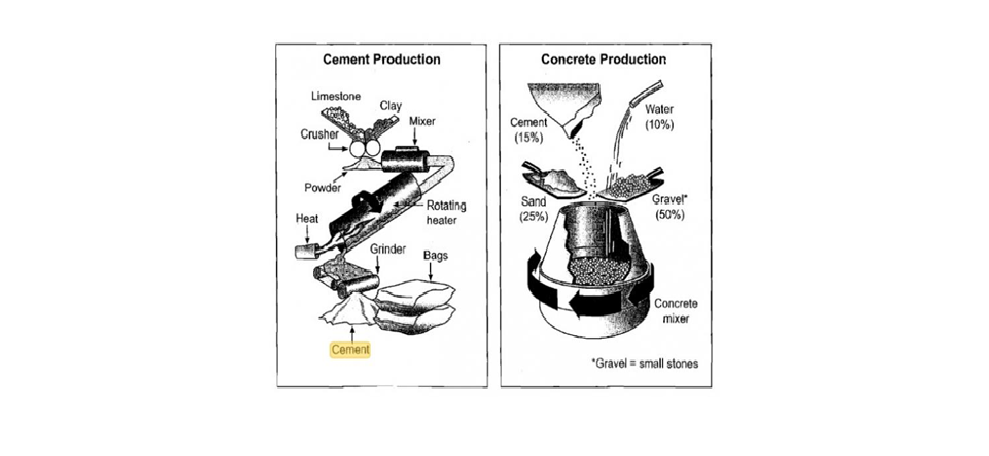
The diagrams below show the stages and equipment used in the cement-making process, and how cement is used to produce concrete for building purposes. Summaries the information by selecting and reporting the main features, and make comparisons where relevant.

================================================================= =======================================

The diagram shows how cement is produced and how is way of using cement to produce concrete for building purposes.

In general, cement is utilized to produce concrete for the construction industry. There have several stages for explaining process making cement.

The first stage, cement (15%), water (10%), sand (25%), and small stones (50%) are entered to concrete mixer. This tool will admix all of material and this matter will be ready to continue next process.

The last stage, limestone and clay are crushed through crusher machine and changed to powder. These powders are mixed together by mixer and gone into rotating heater which works with heat. After that these materials are gone into grinder and changed to cement which are packed to bags.

In conclusion, cement is produced by mixing two elements while concrete is produced by mixing four elements that gravel has the highest proportion.


  • process_making_cemen.png
Eva Novita Sari   
Apr 26, 2014
Writing Feedback / IELTS TASK 1: How greenhouse gases [3]

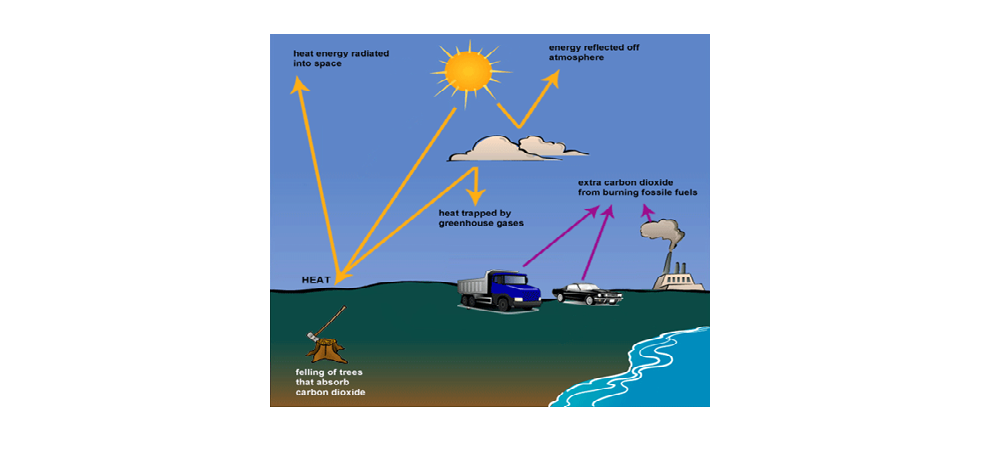
The diagram gives information how greenhouse gases trap energy from the Sun.

Generally, it can be seen that earth undergo greenhouse which is caused by process several factors .

Firstly, many people in the world are cutting trees. With the result, earth becomes heat. Then, sun shines earth that is heat energy radiated into space. This is then energy reflected off to atmosphere. Next process, many people are establishing build especially company which is producing smoke or carbon oxygen that is dangerous toward environment, it is continuing which extra carbon dioxide from burning fossil fuels is brought to atmosphere that is cause atmosphere become thin and because greenhouse.

Secondly, in the earth, many people are using transportation such as truck, and car. They can cause pollution because they have carbon which is dangerous toward environment. This is then extra carbon dioxide from burning fossil fuels and it is continuing to atmosphere.

To sum up, the diagram shows attitude of humankind that are causing effect negative toward earth.


  • greenhouse.png
Eva Novita Sari   
Apr 26, 2014
Writing Feedback / IELTS: Greenhouse gases trap energy from the sun [9]

This.This heating can not absorbed by O2 because felling of trees. Effect of heating in the earth, heat energy radiated into space.

you should be careful toward your words :)
Eva Novita Sari   
Apr 25, 2014
Writing Feedback / IELTS: electricity generated in Germany and France in the year 2009 [6]

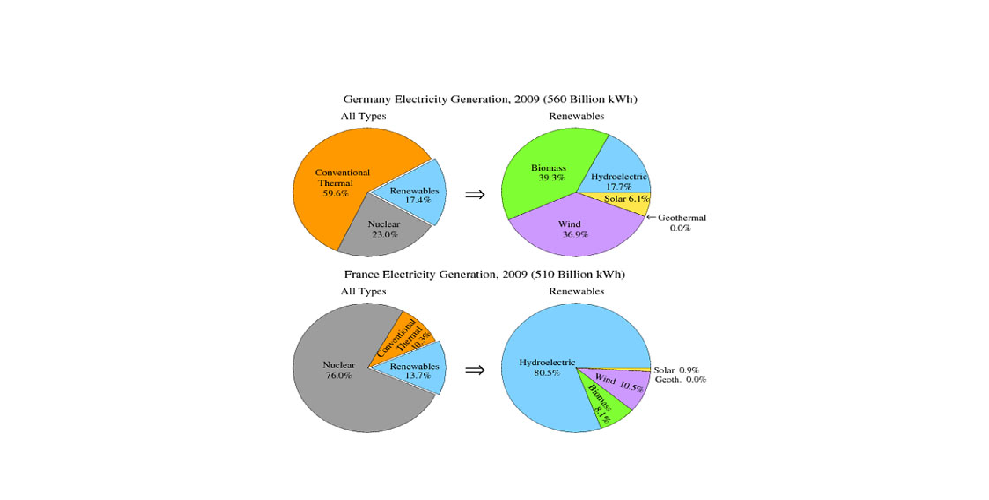
The pie shows the electricity generated from several source in Germany and France in the year 2009.

Generally, there are consisting of all type and renewable with 560 billion kilo watt hour and 510 billion kilo watt hour.

Firstly, electricity of Germany in 2009, all types were consisting of conventional thermal, nuclear, renewable which had different percentage. This was electricity of conventional thermal that increased approximately 59.6%. By contrast, nuclear and renewable had value fewer and decreased sharply rates 23 % and 17.4%. Moreover, renewable had divided consisting of highest biomass approximately 39.3%, continued wind rates 36.9%. Then, it followed by lower or decreased steadily which were hydroelectric, solar rates 17.7% and 6.1%. By contrast, geothermal had percentage 0.0%. It was lowest than others.

Secondly, electricity of France, all type were consisting of nuclear approximately 76.0% which was highest, continued to fall sharply between conventional thermal and renewable rates 10.3% and 13.7%. However, renewable had divided that was consisting of hydroelectric which was highest approximately 80.5%, continued to fall sharply that was wind, biomass, and solar rates 10.5%, 8.1%, and 0.9% respectively. By contrast, geothermal had percentage 0.0% which was lowest than others.

To sum up, the data gave information the electricity of Germany more economical than France and hydroelectric highest in France and geothermal was lowest than others.


  • electricity_generati.png
Eva Novita Sari   
Apr 24, 2014
Writing Feedback / IELTS: The relative electricity consumption; 'spa is more extravagant used' [5]

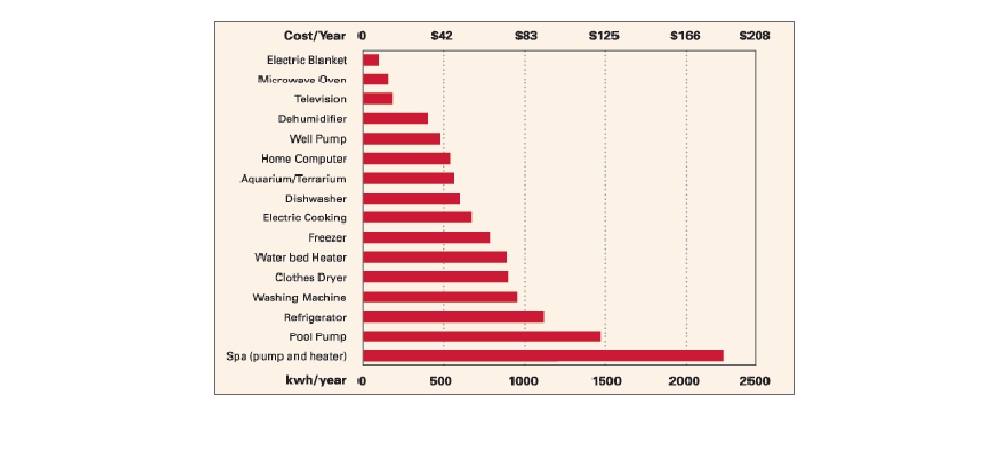
The bar chart illustrates the relative electricity consumption and cost per year of various household devices.

Generally, there are several electricities in the household that have cost per year.

Firstly, the electricity is lower cost per year that is electric blanket, microwave oven, and television approximately 200 kilo watt hour per year with less than cost per year. However, people use tools household in their house such as dehumidifier, well pump, home computer, aquarium or terrarium, and dishwasher which are beginning to rise steadily less than 500 kilo watt hour per year with approximately less more $42 cost per year.

Secondly, other tools electricity have risen steadily which are consisting of electric cooking, freezer, water bed heater, clothes dryer, and washing machine that are more less approximately 1000 kilo watt hour per year with among $83 cost per year. By contrast, refrigerator, poop pump, and spa (pump and heater) are rising sharply approximately 1100, 1480, and 2250 kilo watt hour per year respectively which people should pay among less than $88, $123, $180 cost per year.

To sum up, it can be concluded that spa (pump and heater) is more extravagant used in the household than others. However, relative electricity consumption is normally between more less $83 cost per year with 1000 kilo watt hour per year.


  • electricity_consumpt.jpg
Eva Novita Sari   
Apr 24, 2014
Writing Feedback / Unemployment rates in US and Japan from March 1993 to March 1999 [6]

Employment rates in US from march 1993 to march 1996 shows fluctuated decrease step by step at 5.5% work force

Hi upinipin...
This is word double verb, you should put conjunction because 2 verb 1 conjunction
:)
Eva Novita Sari   
Apr 24, 2014
Writing Feedback / IELTS 1:Type of fast food consumed by Australian teenagers from 1975 to 2000 [4]

Summarize the information by selecting and reporting the main features and make comparisons where relevant.
================================================================= ========================================

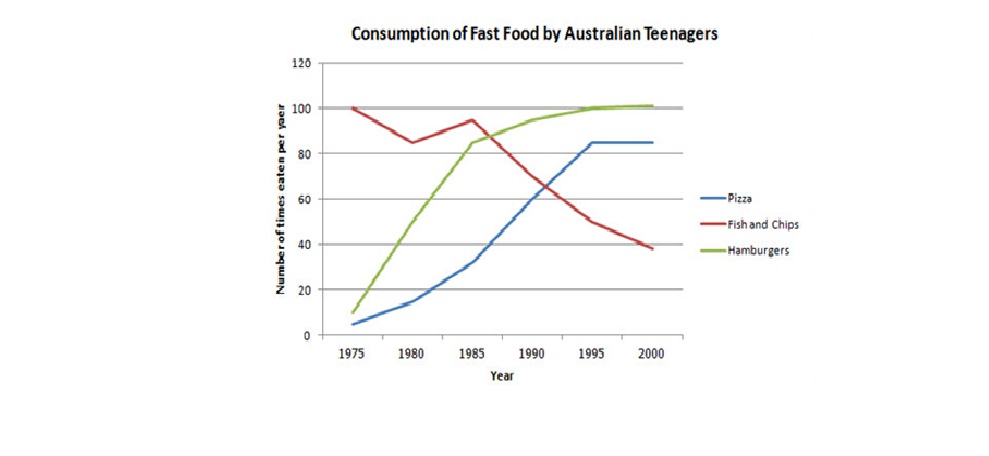
The graph illustrates change in the number and king of fast food consumed by Australian teenagers from 1975 to 2000.

Generally, it can be seen that the graph shows rate of people in Australian who like several foods.

Firstly, in 1975 teenager in Australia liked eating pizza approximately 5 people per year which climbed slightly in 1980 with rates 18 persons per year and it rose sharply until 1995 among 82 people. However, it remained reasonably steady between 1995 and 2000. By contrast, people were interested hamburgers for eating from 1975 approximately 17, and it rose sharply in 1985 with rates 85 people per year. Next, it remained reasonably for year later from 1995 to 2000.

Secondly, teenager were consuming food such as fish and chips which were in 1975 approximately 100 number of time per year. However, in 1980, it began to fall among 85 people per year, and despite slight rise among 90 people per year in 1985, continued to decrease sharply more less 80 people per year until 40 people in 2000.

To sum up, it can be concluded that number of people were consuming pizza and hamburgers which is normally more less 80 people per year.


  • food_in_Australia.jp.jpg
Eva Novita Sari   
Apr 23, 2014
Writing Feedback / IELTS TASK 1: The winter heating costs according to heating fuel type [4]

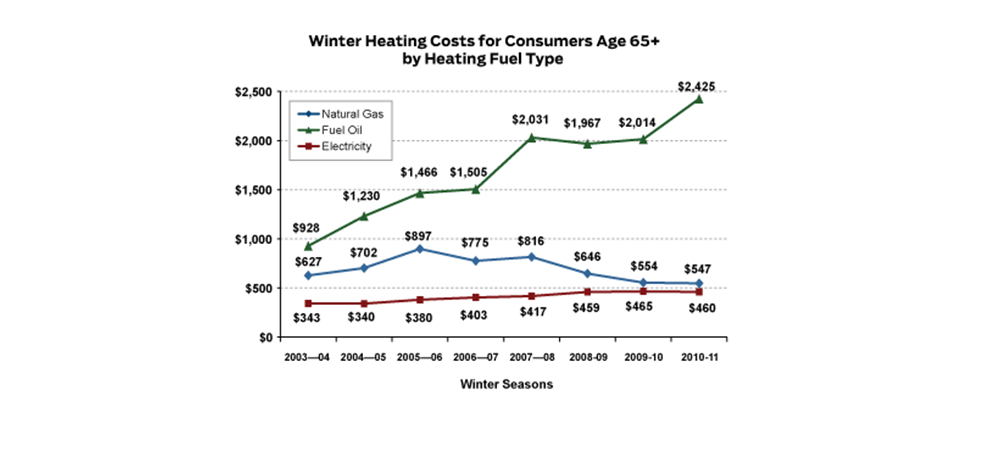
The graph shows the winter heating costs according to heating fuel type from 2003 to 2011.
Summarise the information by selecting and reporting the main features, making comparisons where relevant.
================================================================= =====================

Answer:

The graphs illustrate the winter heating costs for consumers age 65+ by heating fuel type from 2003 to 2011.

Generally, it can be seen that prize heating fuel type in winter seasons from 2003-2010.

Type of heating fuel was consists of electricity, natural gas and fuel oil. The first of all, prize of electricity in 2003-04 was approximately $343, and in increased slightly among $340 in 2004-05. Then, it climbed even higher respectively until approximately $460 in 2010-11 in winter seasons. The second of all, prize of natural gas in 2003-04 was approximately $627 that reached a new peak in 2005-06 among $897, and it decreased slightly in 2006-07 approximately $775. Then, it increased again, but it began to fall sharply in 2009-10 among $554. This was then undergone remained reasonably from 2009-10 until 2010-11.

The lastly, prize of fuel oil undergone increasing steadily from $928 in 2003-04 until $1.466 in 2005-06, and it happened saturation between in 2005 and 2006. However, it began to be climbed sharply in 2007-08 with prize approximately $ 2.031, but it decreased slightly again just among $1.967. Then, it increased sharply in 2010-11 approximately $2.425.

To sum up, prize of heating fuel type was expensive than electricity and natural gas.


  • season_winter.png
Eva Novita Sari   
Apr 23, 2014
Writing Feedback / IELTS TASK 1 : The winter heating cost costumers [4]

Fuel oil iswas higher cost for fuel heater. From 2003 to 2007 increased sharply at $1.505. This number continuescontinuedto be rose sharply until the end of year 2010 $2.425.

Eva Novita Sari   
Apr 23, 2014
Writing Feedback / radio and television audiences throughout the day in 1992. [8]

Write a report for a university lecturer describing the information shown below.
================================================================= ========================================

Answer:
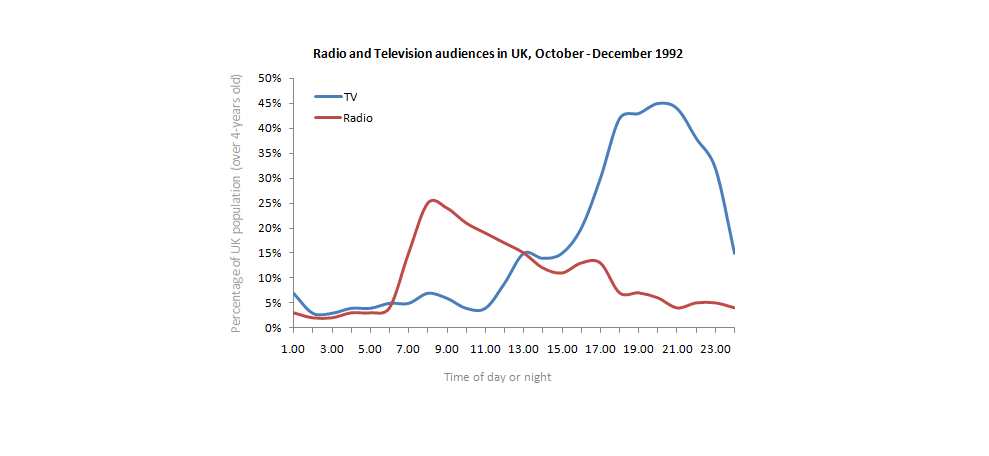
The graph gives information about audience in UK who is interested toward radio and television throughout the day in 1992.

Generally, there are explained how percentage of UK population like radio and television from October- December 1992.

Firstly, in 1992, people in UK was interested hearing radio approximately 3 percentage of over 4-years old at 1 o'clock, and it climbed ever higher to almost 25 % at 8.00 o'clock. However, it began to fall to be just above 23 % at 9.00 o'clock which fell steadily until at 13.00 o'clock. Then, it began to fall sharply at 15.00 o'clock among 10 %, and this graph undergone fluctuating until middle night which many persons undergone decreasing sharply to hear radio.

Secondly, some people were interested watching television approximately 13 % at 1.00 o'clock, and it fell slightly at 2.00 o'clock. However, this data increased steadily until 8.00 o'clock that undergone fluctuation respective. Then, it increased sharply at 18.00 o'clock approximately 43 % that fell sharply at 23.00 o'clock.

To sum up, some people was more interested watching television than radio at 18.00 o'clock - 21.00 o'clock that undergone to fall sharply at the time.


  • Radio_and_TV_in_UK.p.png
Eva Novita Sari   
Apr 22, 2014
Writing Feedback / IELTS: Sector of the economy - different age groups were employed. [4]

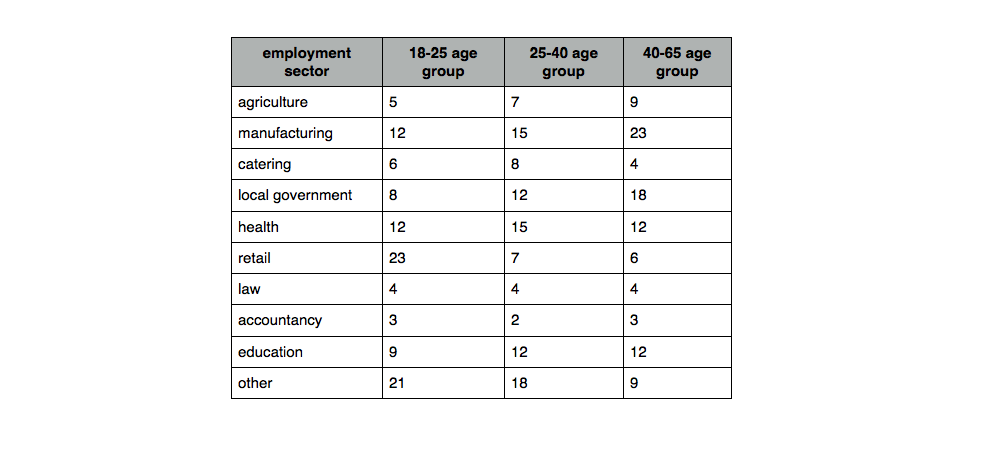
The table below shows the in which sector of the economy different age groups were employed.
Summarise the information by selecting and reporting the main features, making comparisons where relevant
_________________________________________________________________ _______________________________________
Answer:

The table shows information which is sector of the economy different age group of employment sector.

Generally, the data explains several categories employment.

Firstly, it is showed employment in several sectors such as accountancy, law, catering, agriculture, and education respectively undergo decrease steadily approximately less than 4-12 employment in groups with from 18-25 age, 25-40 age, and 40-65 age. Then, employment in sector accountancy is lower than others approximately 2-3 employment.

Secondly, however, the data estimated employment in several sectors undergo increase steadily such as local government, health, manufacturing, and other with age of employment among 18-65 age whom work in there. By contrast, employments work in the retail which has many persons approximately 23 people with 18-25 age. However, worker is from 25-26 age decrease sharply.

To sum up, the data is providing statistical information which is increasing employment in several sectors of depending from age them and sector what they want to join.


  • tuesday_001.png
Eva Novita Sari   
Apr 22, 2014
Writing Feedback / IELTS: visits abroad; some persons visit to abroad because they have some gains [4]

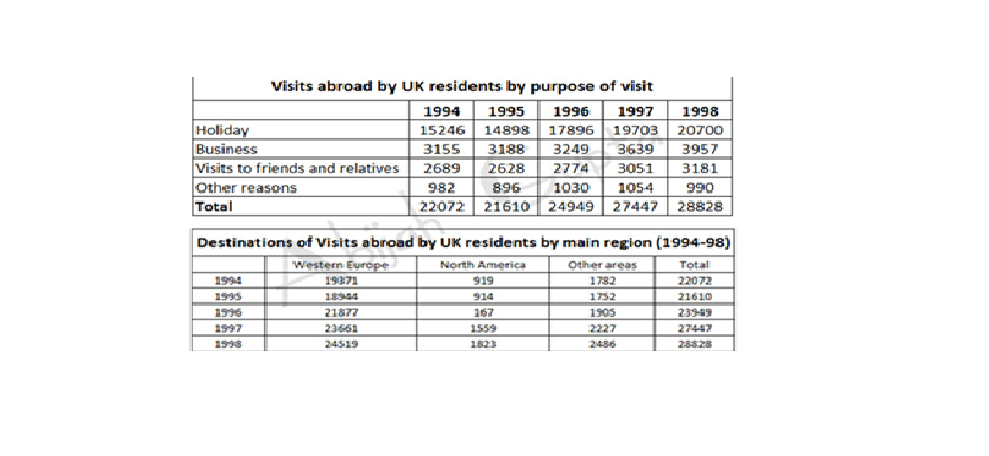
The table provided information on visits abroad and the destinations by the UK residents.

Generally, there are many groups to go to visit to abroad and they have different add every year.

Firstly, in 1994, many persons were visiting to abroad approximately 15246 at holiday. This was then decreased slightly approximately 14898 in 1995. After that, it rose sharply in 1996 until 1998 among 17896, 19703, 20700 respectively. Then, some people have some business in abroad and they have increase every year to go abroad. Next, visits to friend and relatives have increase and other reasons have rose sharply .

Secondly, many persons go to Western Europe have increased sharply every year from 1994 and 1998. This was then North America undergoes fluctuated every year and other areas have increased grammatically every year in 1994 until 1998 and other areas have percentage people increase steadily.

Overall, The data undergoes increase steadily where some persons visit to abroad because they have some gains.


  • table.png
Eva Novita Sari   
Apr 22, 2014
Writing Feedback / Write a report about education in Australia between 1997 and 2005. [5]

Writing Task 1 (a report)
Write a report about education in Australia between 1997 and 2005.
_________________________________________________________________ ________________________________________
Answer:
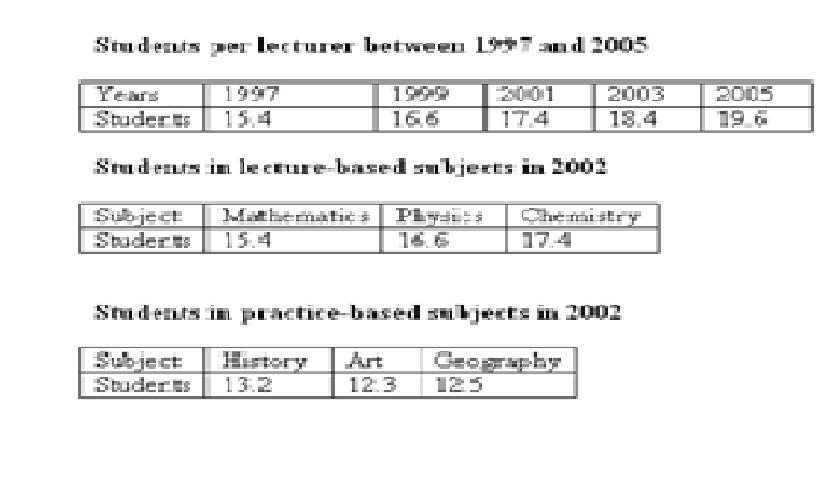
The tables show information about the students per lecturer and the number of students in practice based subjects and lecture based subjects.

Generally, There are providing statistical information about the proportion of students per lecturer during 1997-2005 and the participation of students in practice in 2002 and lecture based subjects in 2003.

In the first table, it is showed that in 1997, the students were continuing education in Australia approximately 15,4 students per lecture. It can be seen that overall, we witnessed increase slightly of students in 1999 approximately 16,6 students per lecture. Next, the greatest increase was observed between 2001, 2003 and 2005.

The last table, the participation of students in based subjects mathematics in 2002, followed by 15,4 students, physics liked by 16,6 students and chemistry had level higher than others what chosen by students. Next, participation of students in practice the most popular was history which was 13.2 student and the figures for art and geography were almost identical approximately 12 students per lecturer.

To sum up, the tables give information that subject of art is less popular than other subjects what liked by many students in Australia.


  • Table_education_Aust.png
Eva Novita Sari   
Apr 21, 2014
Writing Feedback / IELTS Task 1: The results of a survey by the UK residents [4]

The second chart shows destination of visits by main regions which shows the majority of visitors go to Western Europe (from 19.371 in 1994 to 24.519 in 1998) and North America (from 919 to 1.823) and other regions (from 1.782 to 2.486 ) over the same period of time.

I think you should use past tense in this sentence because you use year
Eva Novita Sari   
Apr 19, 2014
Writing Feedback / IELTS:The process that is used to manufacture bricks for the building industry. [3]

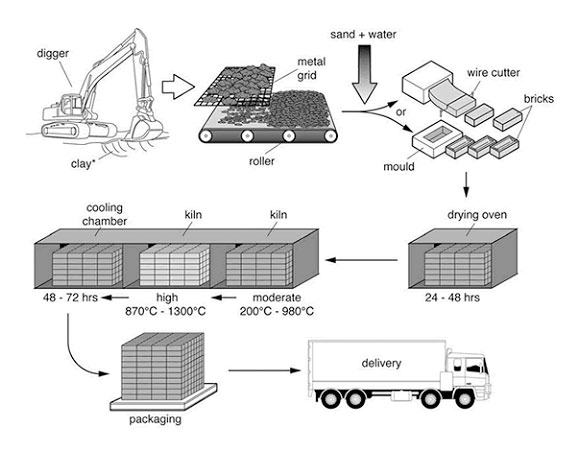
The diagram illustrates the process that is used to manufacture bricks for the building industry.
Summarise the information by selecting and reporting the main features, and make comparisons where relevant.
_________________________________________________________________ _______________________________________
Answer:
The diagram shows process are made bricks for the building industry.

Generally, there are through seven points, beginning with the digging up of clay and culminating in delivery.

Firstly, digger is operated for taking clay. This clay is then placed onto a metal grid to be filtered a small part from clay and sieved with using roller for choosing the clay good quality. Following this, clay are involved with sand and water and this mixture is formed with using mould or using a wire cutter.

Secondly, following this, bricks are dried by oven during 24-48 hours. Next, it is placed into kiln with moderate approximately 2000 C - 9800 C. Then, bricks are moved to high temperature among 8700 C - 13000 C. Cooling process, bricks are cooled with using chamber during 48 - 72 hours. Next, bricks are packaged and it is ready to be delivered to consumer.

Overall, process are making bricks which needed long time for resulting good quality.


  • ieltsprocessbricks.jpg
Eva Novita Sari   
Apr 19, 2014
Writing Feedback / IELTS; 'unique from other animals' - How life cycle of a frog? [3]

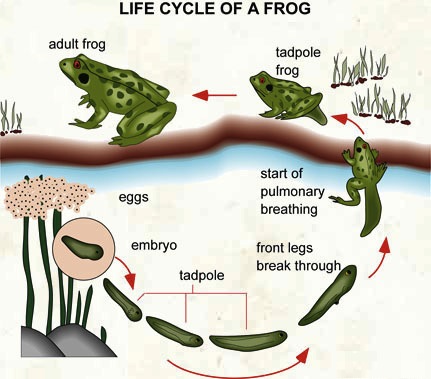
The diagram shows how life cycle of a frog.
Summarise the information by selecting and reporting the main features, and make comparisons where relevant.
_________________________________________________________________ ________________________________________

Answer:

The diagram gives information about the phases in the lives of frogs.
Generally, It can be clearly seen that, their life cycle encompasses the forms from eggs to mature frogs.

Firstly, the whole process starts when frogs mate on the land and it leads their females to lay eggs on the ponds. Then, frog's egg crack turn into small embryo that have a tiny body and slippery skin. Those embryo turn into small tadpoles living forms that have a tiny body and a long tail. That is followed by their development step which tadpole starts grow front leg break through.

Lastly, tadpole grow to turn into young frog that it has tail more short than previous and start of pulmonary breathing. Then, young frog turn into tadpole frog and throughout that phase they experience significant changes as their tails get shorter in addition to the emergence of the front limbs. After that, it turns into adult frog and it can live in the land.

To sum up, frog has life cycle that unique from other animals and frog can breathe in the water and in the shore because it has gill and lungs.


  • froglifecycle.jpg
Eva Novita Sari   
Apr 19, 2014
Writing Feedback / Apple canning process; 'sterilizing from bacteria' [8]

Then, truck carrier apple comes to transporting apples for Carrier to the factory. The next stage, all of apples undergo isare [quote=upinipin]

After that, cold storing process and then enter to weighing

washing process and then is selecting process one by one for quality.[/quote]... confusing... where is subject ?

After weighing all of apples isare peeled and then is sliced. Apples idare [quote=upinipin]

After that, is labeling. ....you should put subject
In each can of apple is labelled by printing machine special for canning food. After that, all of the can is entered into storage. And the end of all process isare dispatching.

.... after using modal, you should put V 1
Slicing with the same shape size pieces.[/quote]

:)
Eva Novita Sari   
Apr 18, 2014
Writing Feedback / Ielts: apple is canned; 'there are many processes' [4]

The company must ensure that apples in a good equality after that they will dispatch apple canned for sale (V ing) .

Hi erny,
after using preposition, you should use V ing
:)
Eva Novita Sari   
Apr 18, 2014
Writing Feedback / IELTS :How apple is canned? 'durable before it is bought' [3]

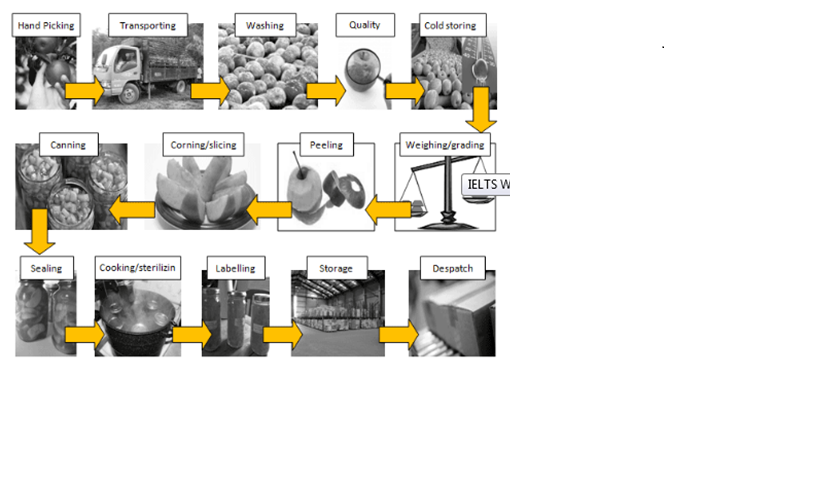
The diagram shows how apple is canned.
Summarise the information by selecting and reporting the main features, and make comparisons where relevant.
_________________________________________________________________ ________________________________________

Answer:
The diagram shows how fresh apple is canned and it gives information about process to make canned fruit from apple.

Generally, apple is fresh fruit that can be saved by using a variety of way. So, company makes canned from apple for durable and apple can be directly consumed by the society without having to wash it again and ready to eat.

Firstly, apple is picked from trees by hand. It is then transported to the cannery by large trucks. After that, apple is washed with using clean water and it is selected good quality and that is not good removed. The good quality apple is put in cold storing. Then, apple is weighed / graded. After this the apple is peeled and cores are removed. Thus, apple is corned becoming a small part.

Secondly, Apple is ready canned by using bottle and it is sealed. Then, it is cooked over heat to ensure that the cans are sterilized. After that, cans are labeled when label is attached and placed into storage. So, the canned of apple is ready to despatched to be sold to market or it can be imported to other countries.

Overall, process is making canned apple that has many steps for getting good product. As a result, it can be durable before it is bought by consumer.


  • diagram_canned_apple.png
Eva Novita Sari   
Apr 13, 2014
Writing Feedback / TALKS IELTS 1: The map of Pellington city - new shopping mall [8]

Question:
Summarise the information by selecting and reporting the main features and making comparison where relevant.
_________________________________________________________________ _________________________________________________________________ ____________
Answer:
The map shows a drawing of Pellington. This city has population 120,000 people and it has three sites for a new hypermarket (A, B, and C).

In general, both of two areas (A and C) crossed by railway, and one site (B) is in Countryside.

The first possible are in the industrial side (C). This location is more perfectly because it is near with worker in the industry which they need something, if they get starving or others. The second location is in Countryside. This is place which is very good for some people because it still natural and far distance with industry company. So, some people can relax in this market, but people should walk as long as time to go there.

However, the last possible area is totally different than one and second. It is located in the residential which is near with traffic-free zone park and industrial. Therefore, many persons always throw this area. With the result, they need place for shopping or buying something for their family. So, they go to this hypermarket. It would be the crowded market.

In short, the last possible area is better because it is the city center and many people cross around it. This place give many benefits for hypermarket for getting opportunity to get much money.


  • map_pellington.jpg
Eva Novita Sari   
Apr 13, 2014
Writing Feedback / IELTS TASK 1; Cinema attendance in the UK [9]

the line graph shows percentageof each age of british in every yearwho attend the cinema.

Hi... upinipin
I think you should look again about using conjunction who.
:)
Eva Novita Sari   
Apr 13, 2014
Writing Feedback / IELTS: The map of Brandfield city - new shopping mall [4]

The map shows a drawing of Brandfield city . The governments of this town plan a new shopping mall. This mall will be placed in two choice areas.

Hello erny,
this is map about Pellington city. :)
Eva Novita Sari   
Apr 13, 2014
Writing Feedback / IELTS TASK 1 - plan to build new supermarket in the city of Garlsdon. [7]

Answer:
The map below shows the details of Garlsdon town of Garlsdon which has a population of 65,000 people.

In general, site plan establishing supermarket (S1) and S2 are crossed by railway and S1 is more far distance from society than S2.

The first possible area for the supermarket (S1) is riveting where it has several cities consist of 25 km to Cransdon has population as big as 29,000 people, and 16 km to Brandsdon consist of population 15,000 persons. Therefore, if many persons in around build of supermarket, I think they will come many benefits for it because many people need some food, dress or others for their family. With the result, they will visit supermarket for buying it. Then, they will choose place which is nearer because some people in around there work in the office industry and they just have a little time. Furtheremore, they have not opportunity to go place far distance. However, S1 has fewer society in around that it is consist of 10,000 society of 12 km to Hindon.

In short, Carlsdon has opportunity for building supermarket in the town centre. It is place strategy place for many people in around.

Need Writing or Editing Help?
Fill out one of these forms:

Graduate Writing / Editing:
GraduateWriter form ◳

Best Essay Service:
CustomPapers form ◳

Excellence in Editing:
Rose Editing ◳

AI-Paper Rewriting:
Robot Rewrite ◳

Academic AI Writer:
Custom AI Writer ◳