Unanswered [14] | Urgent [0]
  

Posts by JasS
Name: Jasur Khabibullaev
Joined: Mar 10, 2014
Last Post: Nov 15, 2015
Threads: 10
Posts: 30  
Likes:
From: Uzbekistan

Displayed posts: 40
sort: Latest first   Oldest first  | 
JasS   
Oct 18, 2015
Writing Feedback / Essay on the climate change - check my introduction [4]

Topic:

Some people think that there are things individuals can do to help prevent global climate change. Others believe that action by individuals is useless and irrelevant and that it is only governments and large businesses which can make a difference.

Discuss both these views and your opinion.


My Intro:

It is believed by some idividuals that people can take preventative measures of world climate change. However, others think that the act of individuals is worthless and that can be more effected by governments and entrepreneurs. In my view, both people and governments are able to influence on it.
JasS   
Apr 10, 2014
Writing Feedback / IELTS: born with certain talents or not?; professional football player [3]

It is generally believed that some people are born with certain talents, for instance for sport or music, and others are not. However, it is sometimes claimed that any children can be taught to become a good sports person or musician.

Discuss both these views and give your own opinion.

It is true that some people have naturel capability such as sporting or playing musical instruments, and others do not have. While it is debated that anyone can learn to be a professional sportsmen or a good musician, I believe that not all individuals are able to do well like talented people.

On the one hand, in my opinion, people can acquire any fields if they have talent. In other word, naturel talented people can progress quickly and get improvements, in the way if they encourage their ability though training. For example, sport master such as Messi, who I have watched his biography film, has great talent of controlling a ball and he has been working on his talent since his childhood. Therefore, now he is a professional football player, as everybody knows. However, if he does not have talent of managing the ball, he could not be a good player.

On the other hand, in fact, some people are not born with certain capability, but they can learn different subjects and become a scientist. The acquisition of knowledge is easier and more affective for them and this may lead not to be necessary being talented for them because they do not need capacity in order to gain knowledge and learn the subjects. For example, early childhood of my uncle had no ability to do something, but he was interested in education, particularly at math. During the growing up, he studied school and higher education and become the accountant of a bank in my country.

In conclusion, being talented is good if people afford to use it in right way. However, I believe that it is unnecessary to people are taught to become a sportsmen or musician, although they do not have natural talent.
JasS   
Apr 5, 2014
Writing Feedback / Ielts task 2: Parents vs teachers: development of a child. [4]

First of all, you should also write what tpye of quastion asking (agree - disagree? or give your opinion etc.)

every teacher has his/her own method of teaching and view

every teacher will tries

JasS   
Mar 20, 2014
Writing Feedback / The chart shows the leisure time enjoyed by men and women of different employment status. [3]

according to their employment status between 1998 and 1999

It can be clearly seen from the figures

have spent a little time

In the second category, there were no given figure for male, but female had 40 hours of leisure, only slightly more than women in full time job category.

Male employees of part time job had no hours of leisure time, while female empleyees was about 40 hours spare time in a week .

HerŠµ too

I think this phrase informal language

men enjoyed more leisure time over 80 hours

You used the grammar structure in wrong way
enjoyed + a adj + noun

compared withto

perhaps women spend more time working in the home than men

Don't add your own opinion, just write what is given on the graph
JasS   
Mar 20, 2014
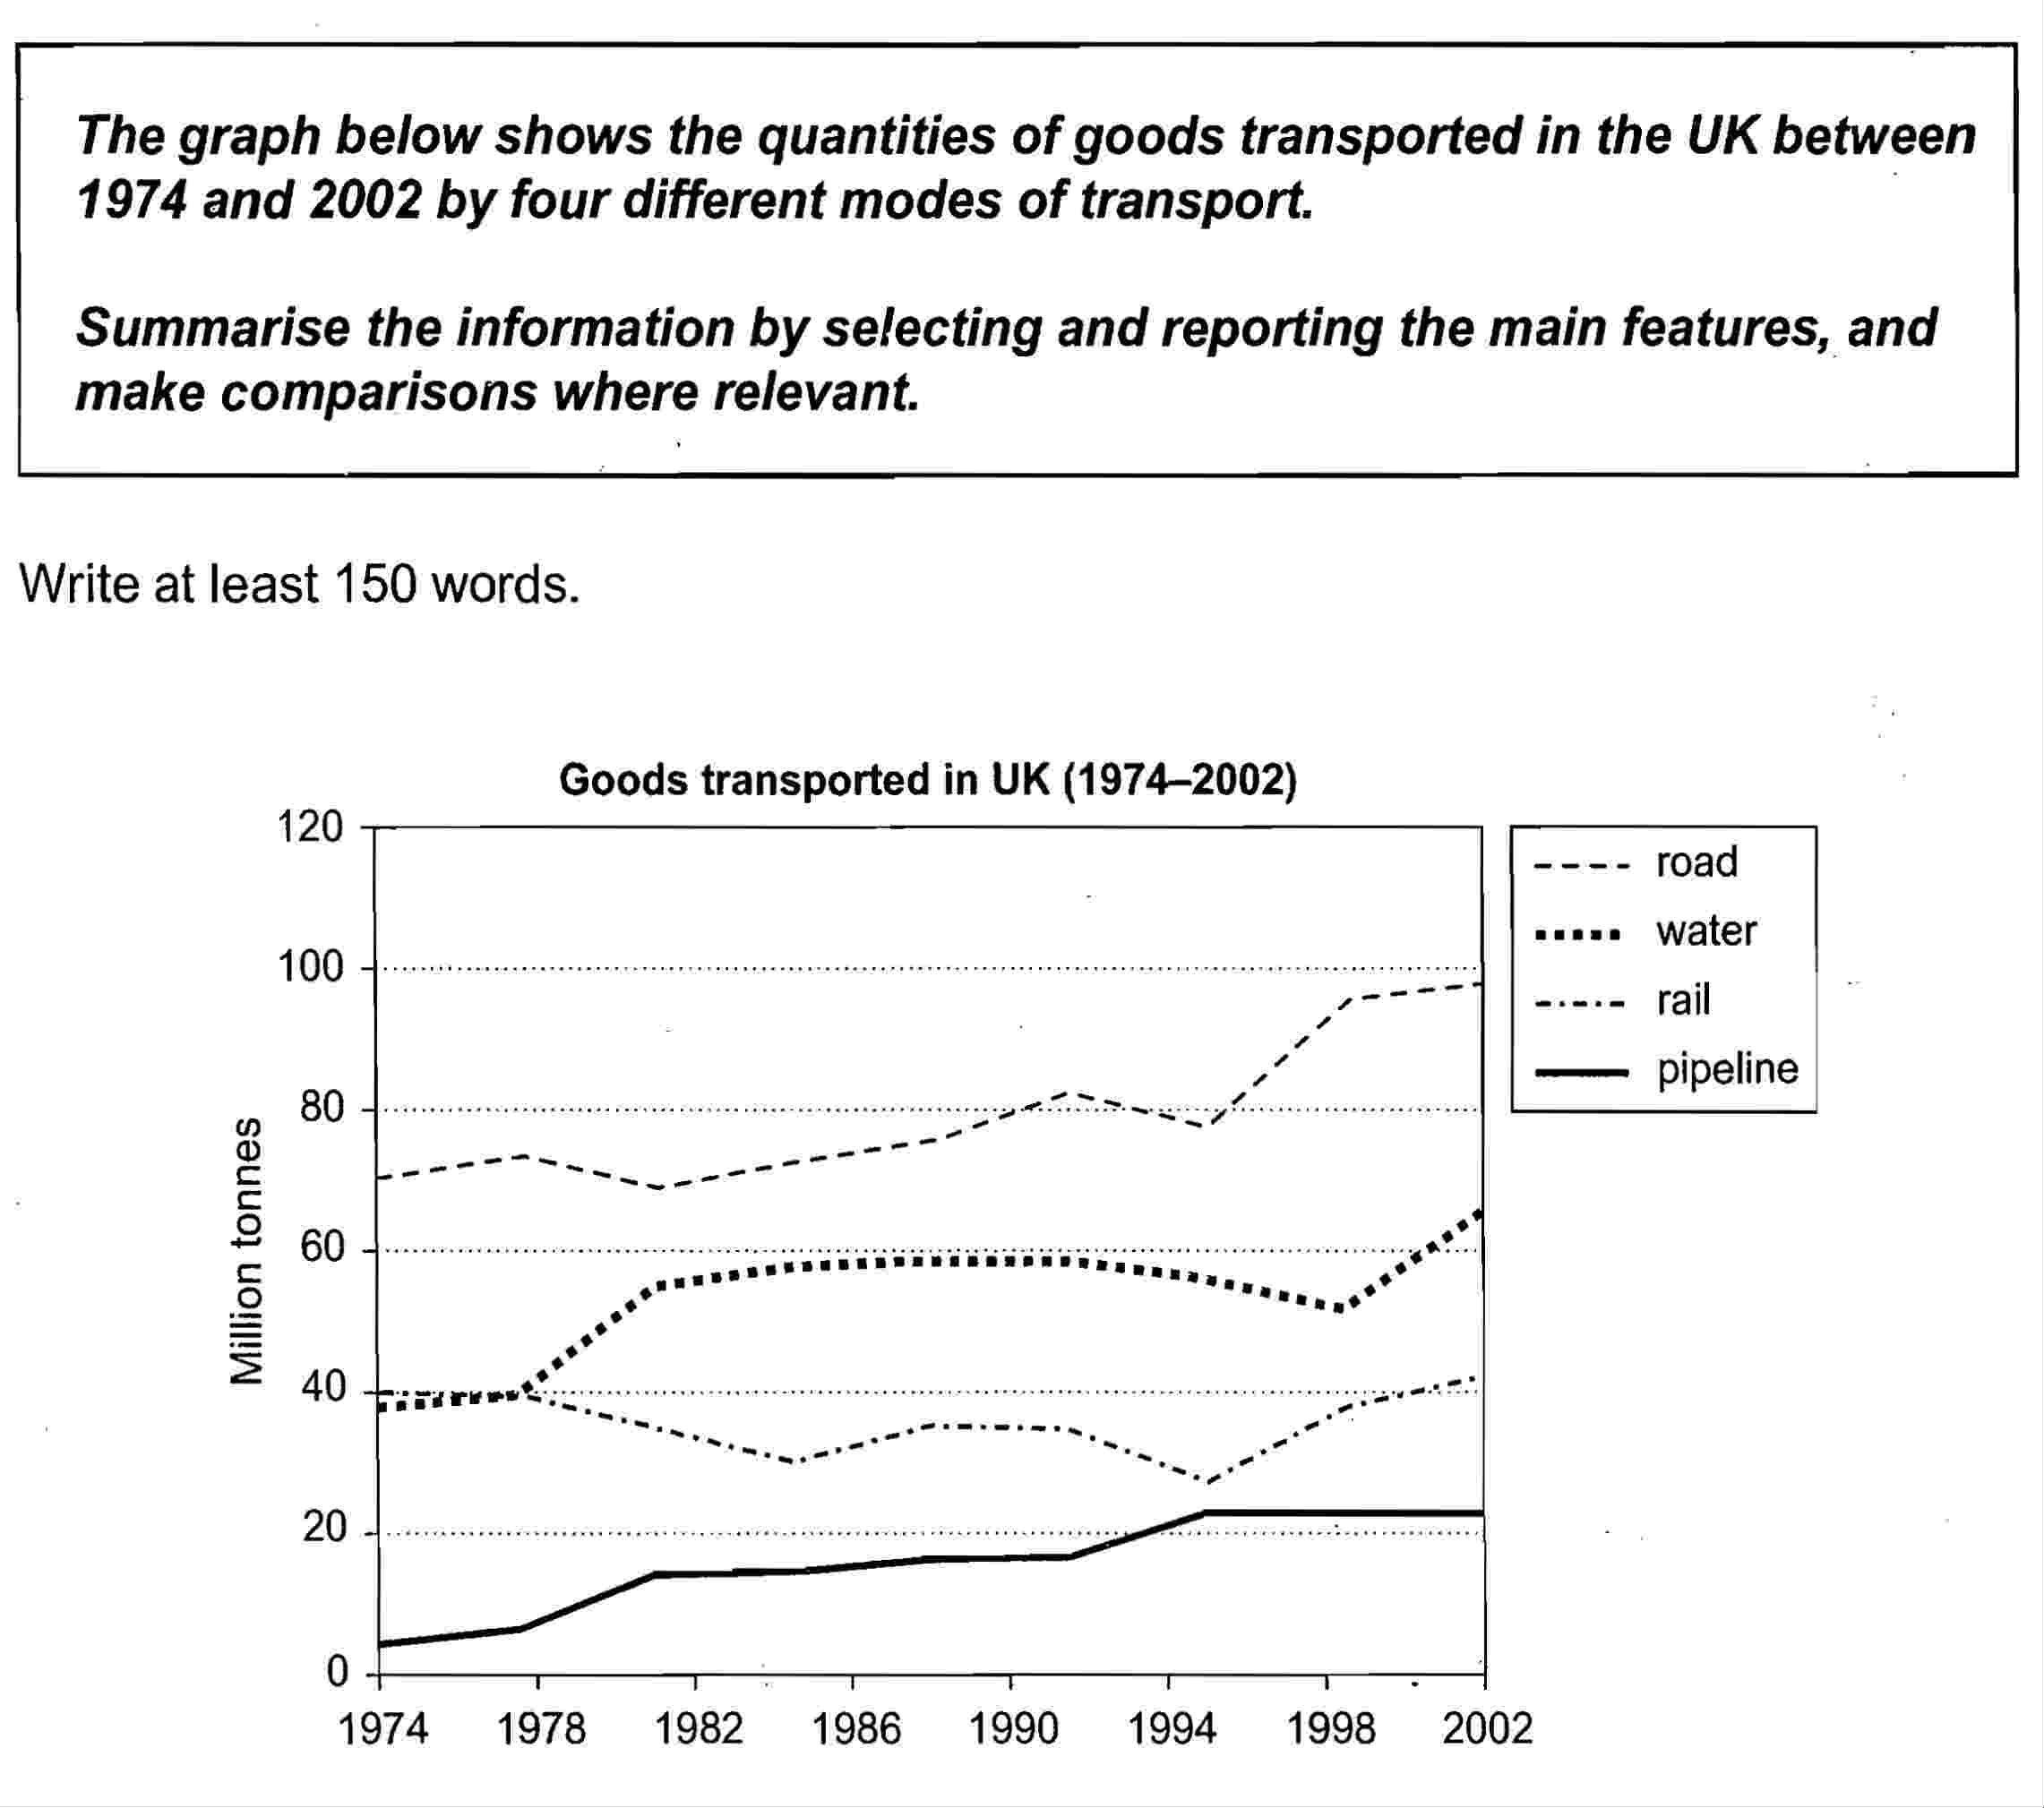
Writing Feedback / IELTS TASK 1 (Line Chart) - Goods Transported by Four Modes of Transport. [4]

The chart compare the proportion of products carried through four various kind of transportation system in the UK during a period of 28 years, from 1974 to 2002.

It is clear that the road was the most common way of transporting goods, while the least popular mode of transport was pipeline in each year.

In 1974, the quantities of goods which transported by road was approximately 70 million tones. This figure had been fluctuated by 1995, then, enjoyed a dramatic increase up to just under 100 million tones. However, there was a slight climb in the way of pipeline from around 5 million tones to just over 20 million tones, during this period.

By contrast, from 1974 to 1978, transferring goods by water and railway stabilized at about 40 million tones. Nonetheless, the former enjoyed a sharp jump to less than 60 million in 1978, then, saw a slight decrease and reached a peak of more than 65 million. Comparing to the letter had dipped at around 25 million tones, before remained stable at 40 million in 2002.


JasS   
Mar 20, 2014
Writing Feedback / IELTS TASK 1 (Diagrama) - The Process of Cement and Concrete Production. [4]

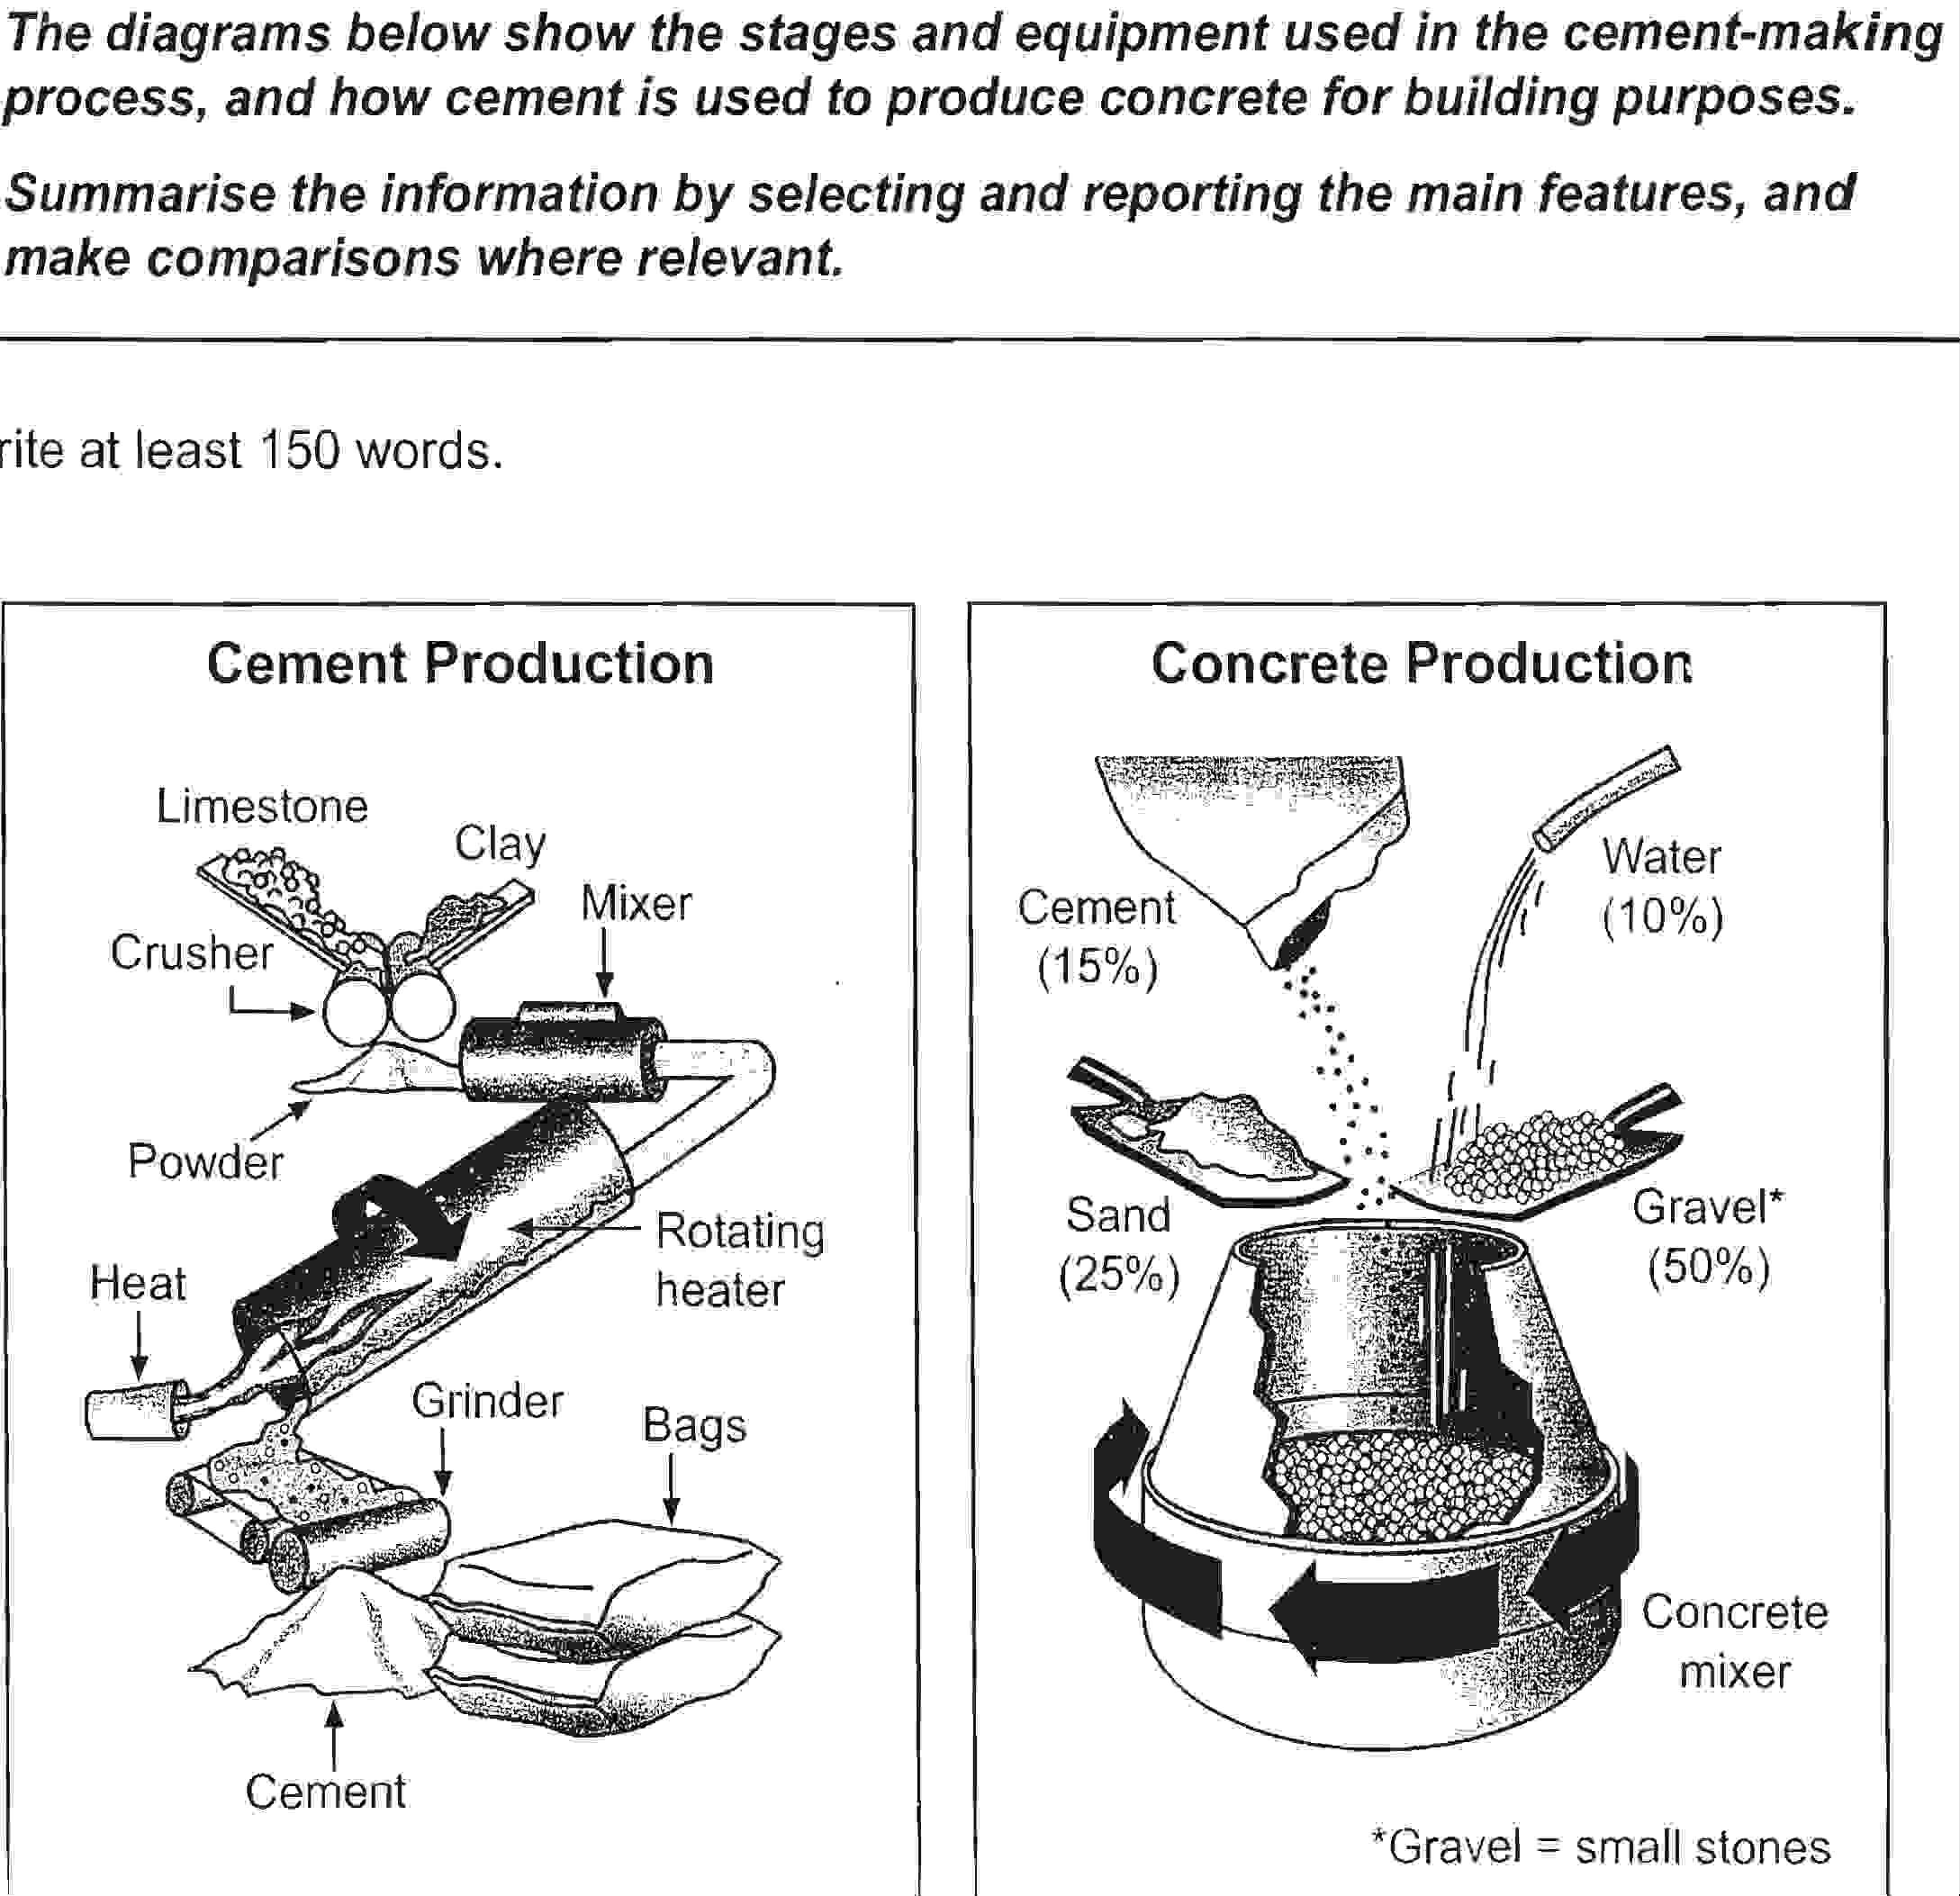
Given is a diagram illustrating the different phases with the special machine in the process of producing cement and the making concrete.

It is clear that there are five main stages including packaging in the full operation of the cement making, while concrete production involves only one stage.

Beginning at the crusher stage of the cement production, we can see that limestone and clay crumbled together to make a powder. At the second stage, the powder hits specially-designed section of the equipment, which mixes. The next stage, the mixture goes to heat in rotating heater section through the pipe. At the next stage, the warmed combination is grinded thus produced cement. Finally, the cement is packed into bags.

With regard to the concrete production, there is only one particular equipment mixed four different elements to create concrete at the same time. The concrete is composed of 15% cement, 10% water, 25% sand and a half of the mixture is gravel.


JasS   
Mar 18, 2014
Writing Feedback / IELTS TASK 1 - Total UK School Spendings! [4]

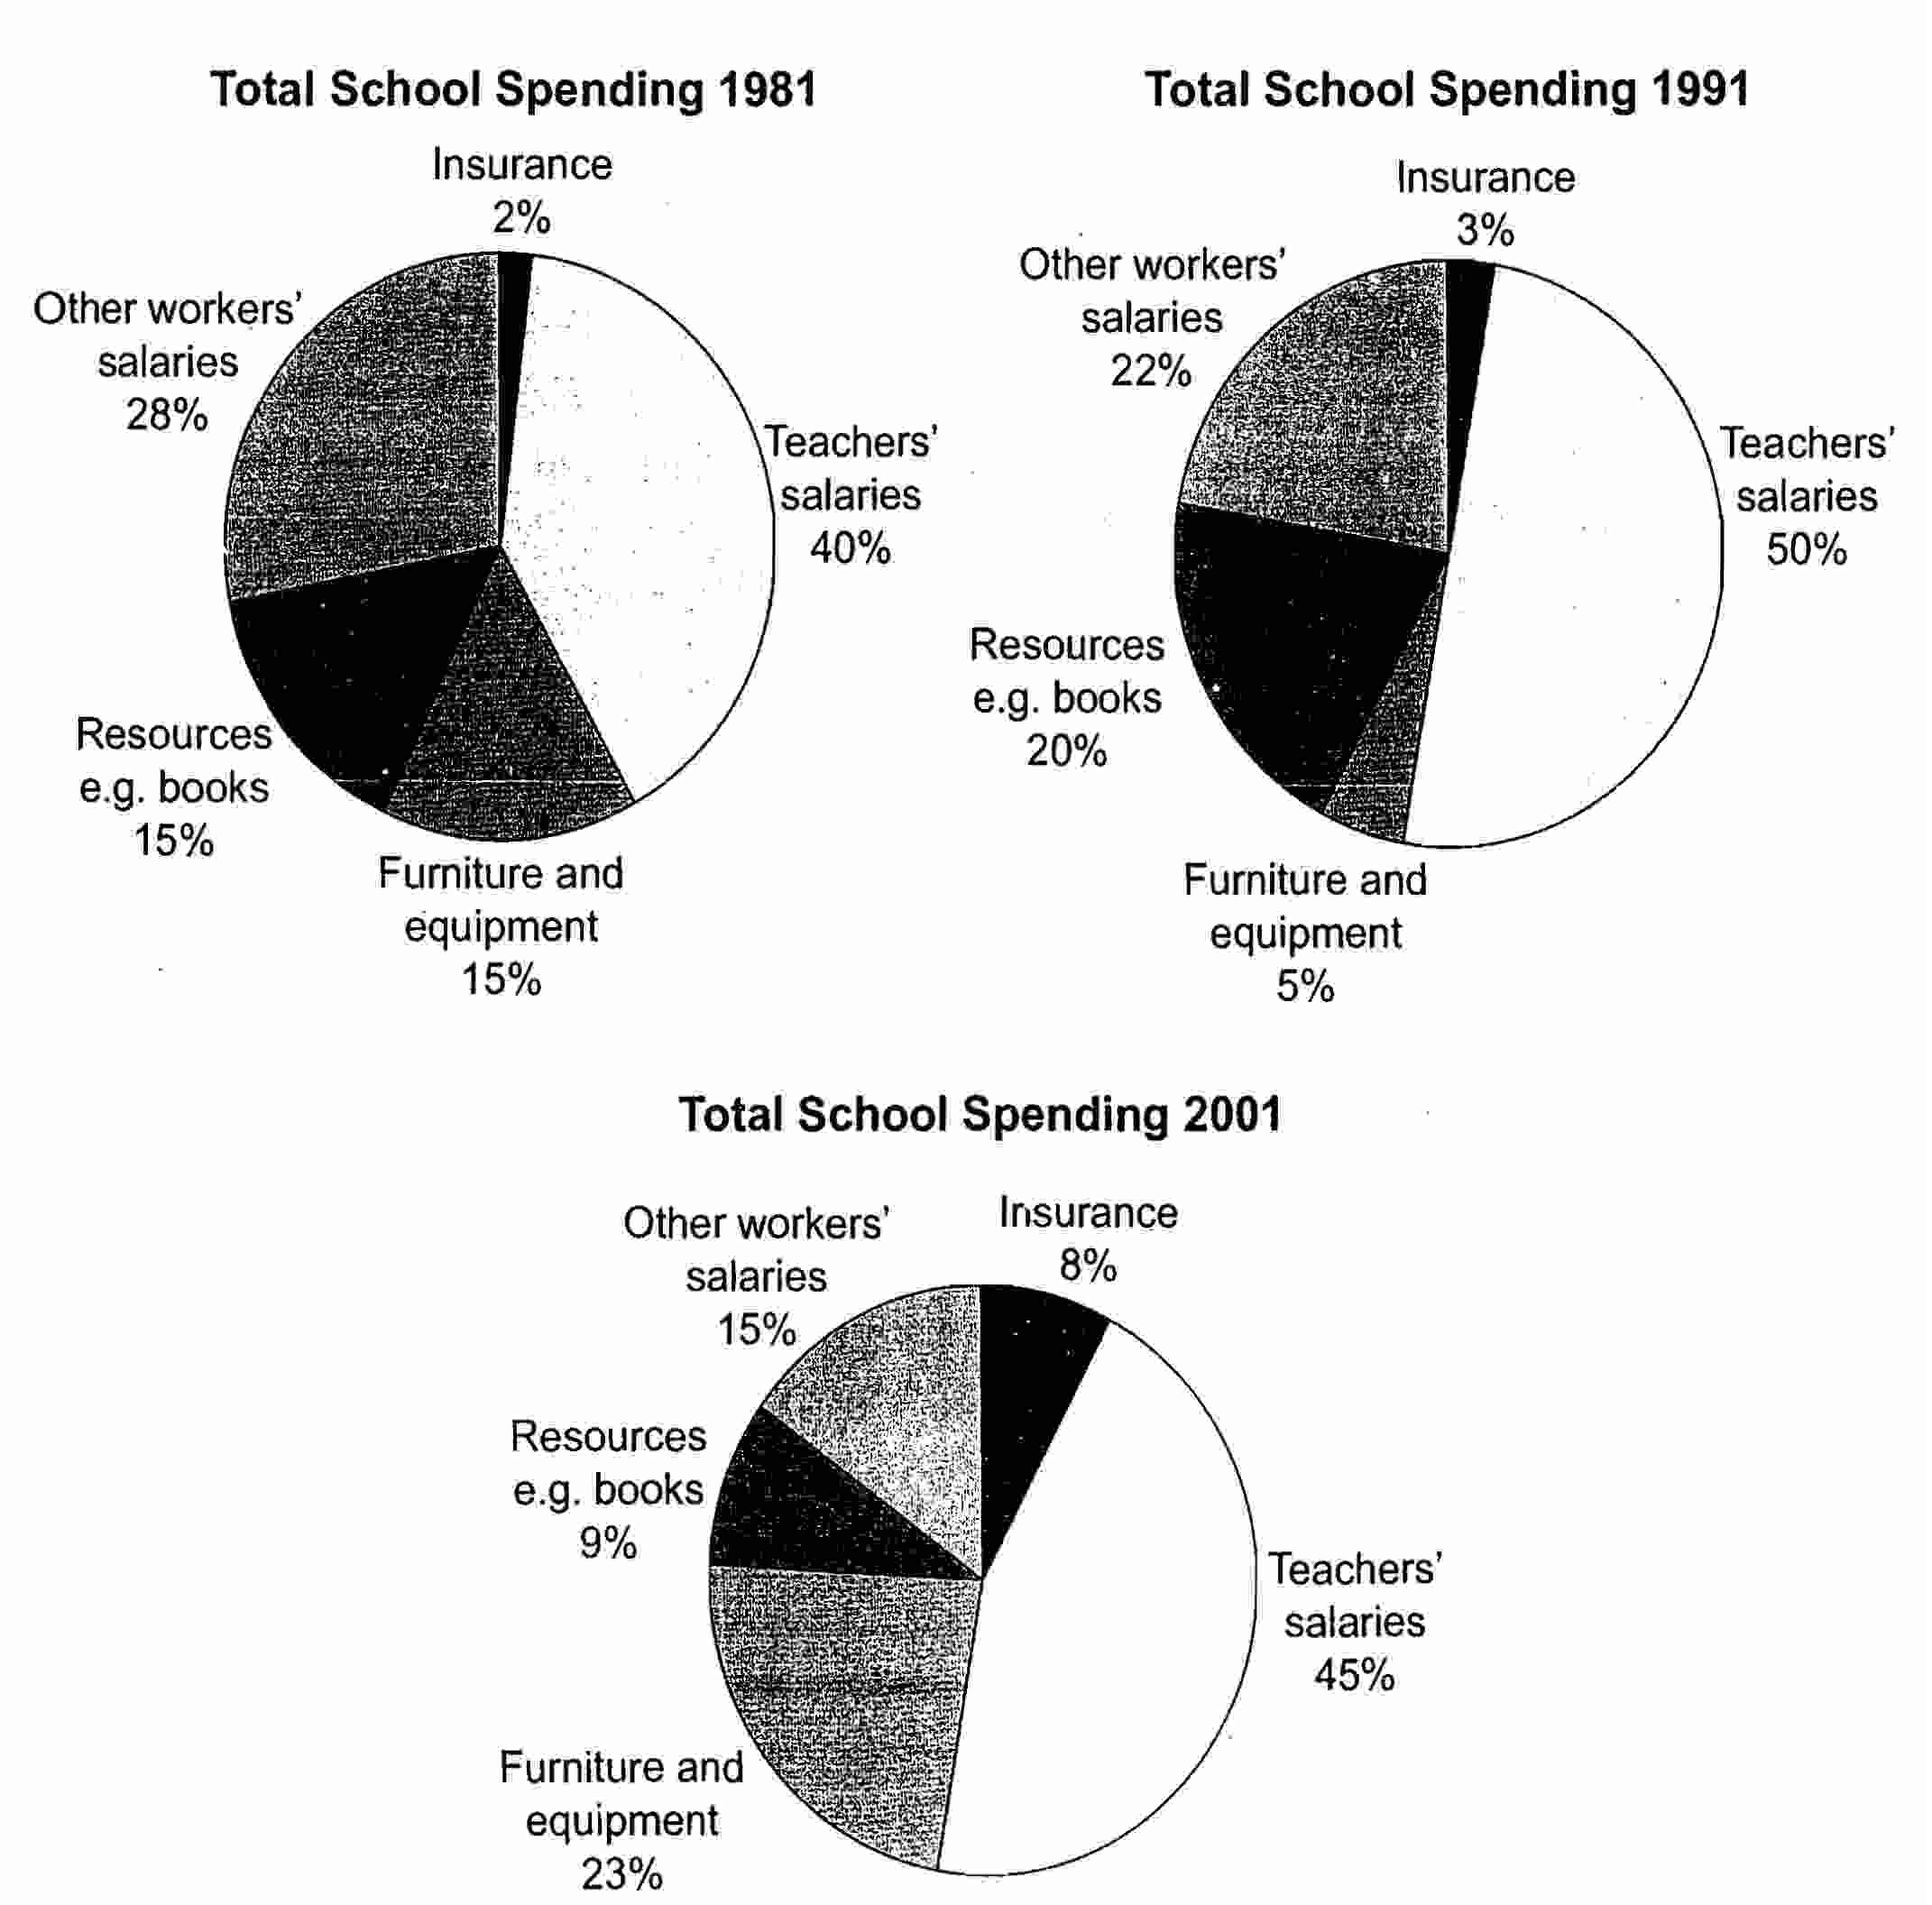
The charts compare the allotments of school expenditure in the UK in three definite years (1981, 1991 and 2001)

It is clear that the workers' salaries were the major expenses, while the smallest percentage of school budget spent to insurance in each year.

Looking at the graphs more details, there was a slight increase in teachers' salaries, from 40% to half between 1981 and 1991. Meantime, the salaries of other workers declined from less than a quarter to just over a fifth. However, in 2001, teachers were paid 45% of total budget, while 15% of money expended to other workers.

By contrast, the total school spending on resources and furniture in 1981 were 15%. The former increased to 20% in 1991 and had decreased rapidly to 9% by 2001, while the letter was 23% of total school spending in 2001. However, the insurance of school spending had not changed almost over the 10 years, but it was 8% in 2001.


JasS   
Mar 18, 2014
Writing Feedback / IELTS TASK 1 - Internet Use in Europe [10]

Thank you for all corrections)))))
But

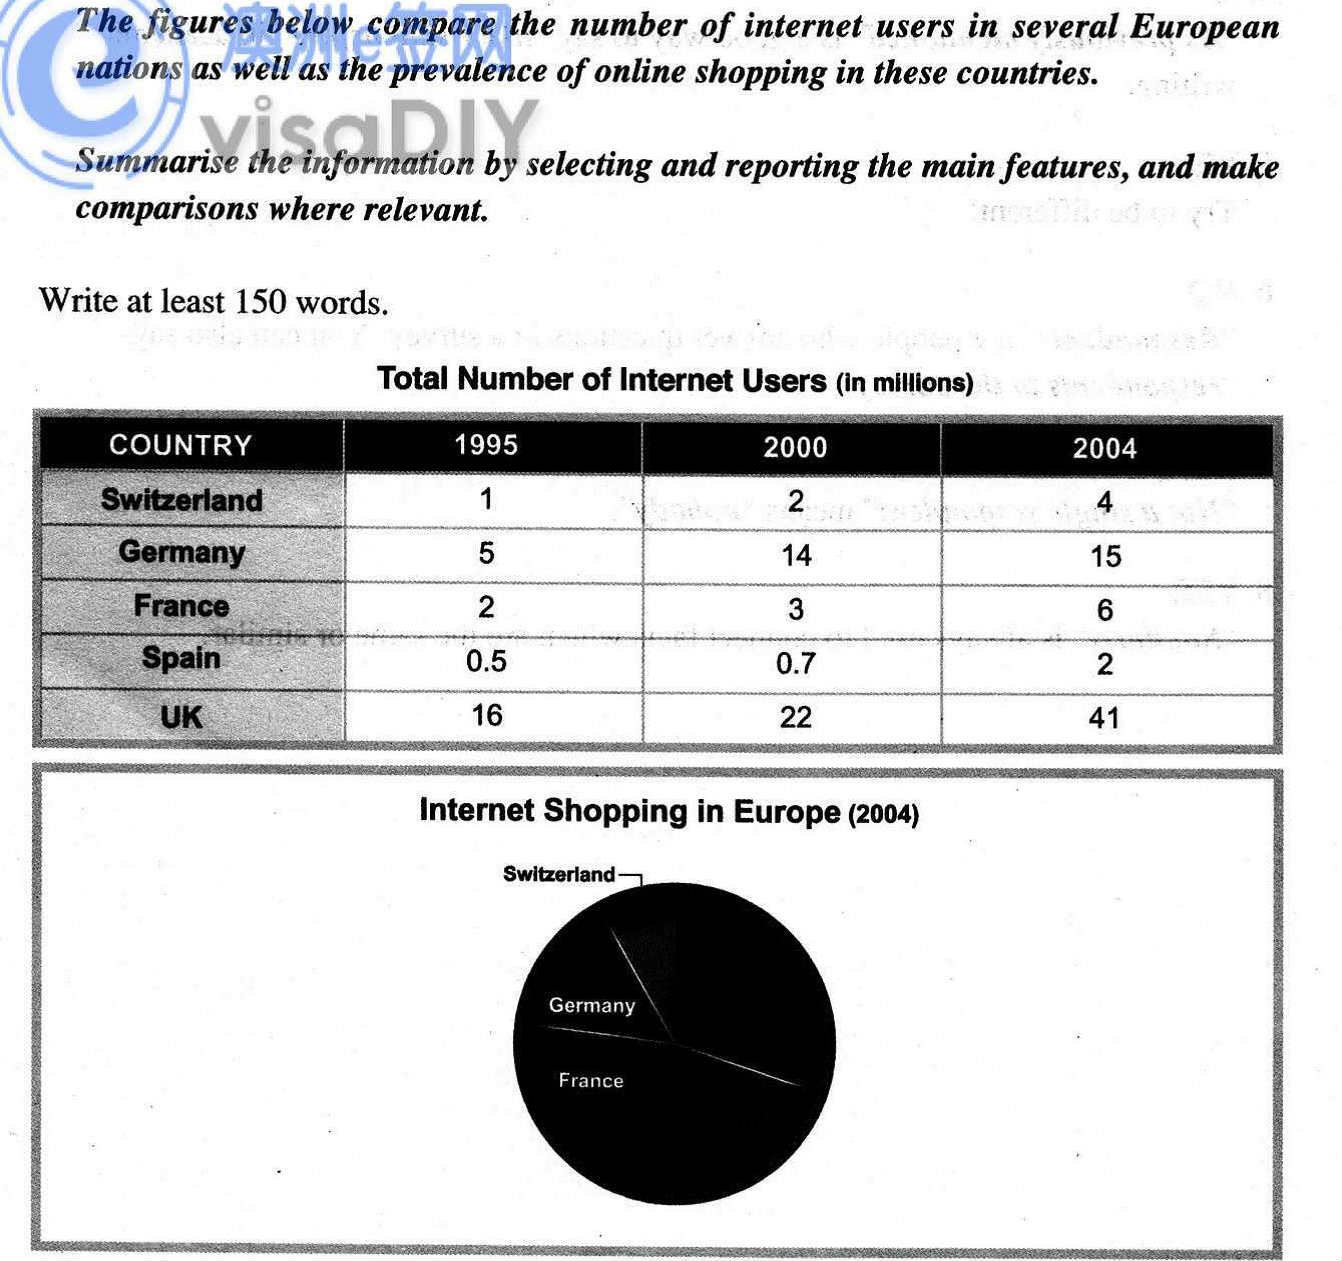
in several European countries in 1995,2000 and 2004

You confused with years))))

At twenty-three per cent

15 per cent

32 %

23% - 15% (not 15 per cent and twenty-three per cent)
and it is also mistake to separate the number and %


in 1995 it had fallen to less than a third of the total.

use "by" with the past perfect (had fallen) to give the idea that the increase had happened in the years leading up to 1995.

jas you did well enough with % as you taught me brother !!!

You lost me bro)
JasS   
Mar 17, 2014
Writing Feedback / International Graduates, Canadian Universities, 2001-2006 [4]

Given is bar chart compares the overseas graduates number of Canadian colleges who come from eight provinces

The chart compares the number of oversea graduaters of the univercities in Canada during a period of 5 years, from 2001 to 2006

Conclusion is not necessary, you've got overview already but there are some details in your overview. Don't give any detail in the overview.
JasS   
Mar 17, 2014
Writing Feedback / IELTS TASK1; The consequence of a survey of grown up person education [5]

In your Intro, you just perephrased words but the structure is still the same. try to change it as well

and you wrote the word ''reason'' many times, it sounds the repetition

In your third body, you gave all details. you have to describe only the main and attractive details.

while the second chart shows people
opinion regarding how payments of adult education should be shared.

The second graph illustrates thoughts about the tuitions of the univercities/higher educations.

it is clear from the bar chart that more significant reasons of adult
education are interest in subjects

Overall/It is clear that most students are intrested in subjects .

and your overview is about only the bar chart. What about pie chart?
JasS   
Mar 14, 2014
Writing Feedback / IELTS TASK 1 (Map) - Planned Shopping Center Locations [2]

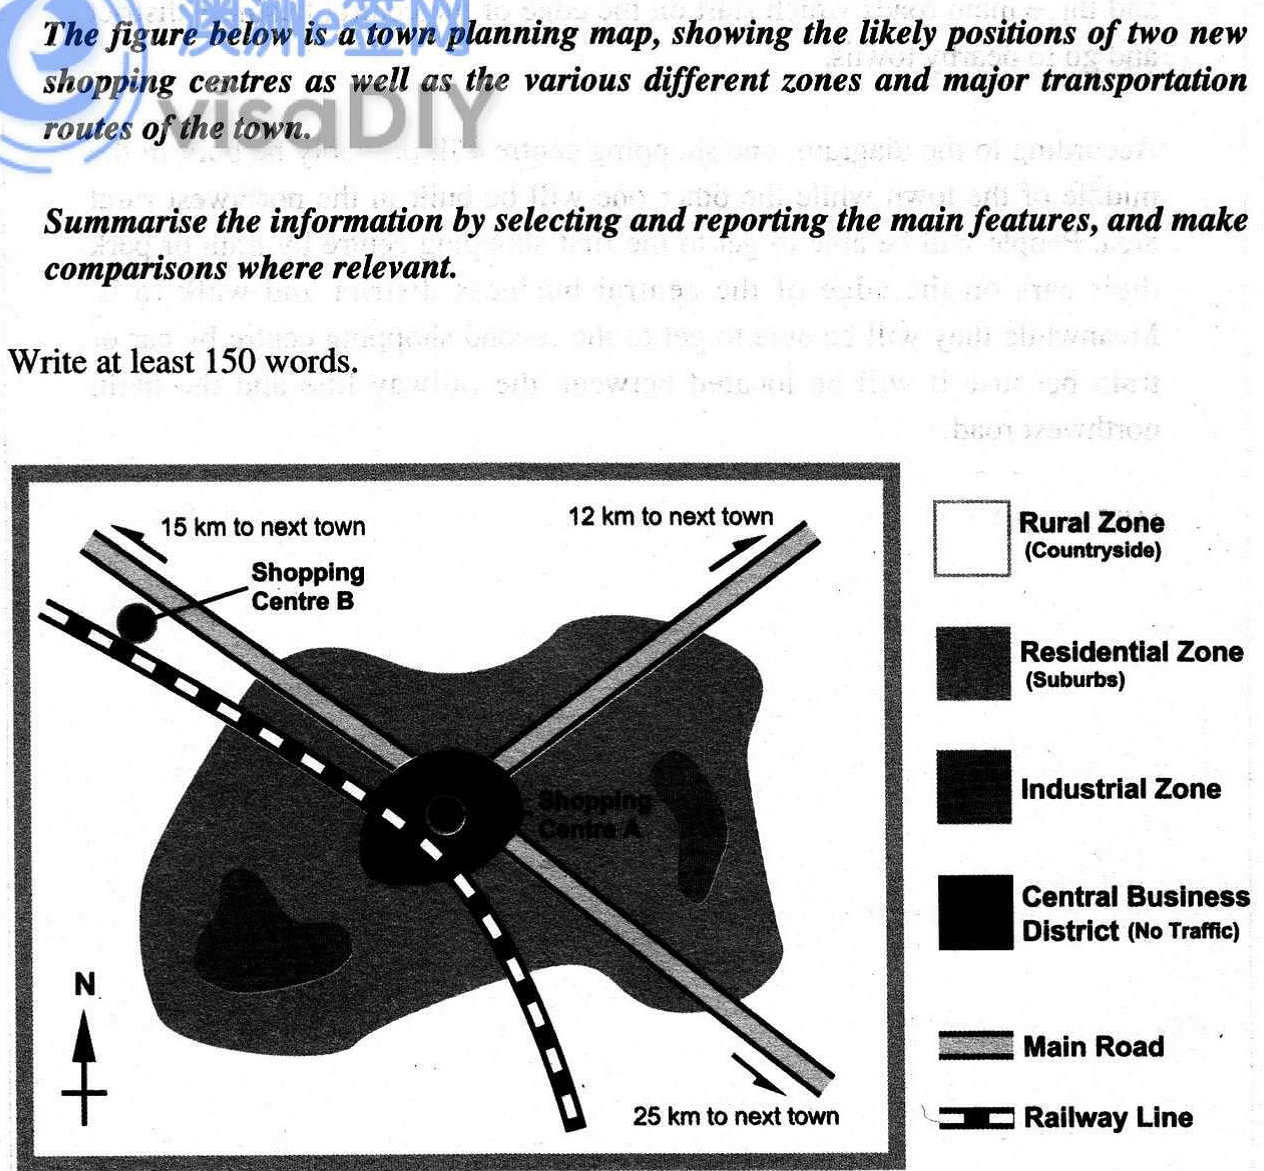
The map shows two potential locations (B and A) for a new shopping center and main transport routes in a town.

The main difference between the two positions is that B is outside the town, whereas A is in the town center. The positions can also be compared in terms of access by road or rail, and their sites relative to three other towns,

Looking at the information in more detail, shopping center B is in the countryside to the northwest of the town, but it is close to the residential area of the town. Shopping center A is planned to establish in the central business district where no traffic.

There are main roads from 12 km, 15 km and 25 km beyond to the town center, but this is a no traffic zone, so there would be no access to the location A by car. By contrast, the location A lies on both the main road and the railway to next town 15 km away, but it would be more difficult to reach from two other towns. Both shopping center sites are close to the railway that runs through the city center from the southeast to the northwest.


JasS   
Mar 13, 2014
Writing Feedback / IELTS TASK 1 - Internet Use in Europe [10]

The charts compare pastime attitudes of adults in Europe over a 10-year period.

It is clear that watching TV made up the largest proportion of the mature activities in both years (1985 and 1995). By contrast, other activities were the smallest one in each year.

In 1985, adults spent their 32% of spare time on watching TV. There was a little fell in this figure from that amount to 30%, a fall of just 2% in 10 years. The proportion of eating out slide away over the 10-year period, from 23% in 1985 to just 8% in 1995.

Enjoying with other attitudes were only 6% of the total in 1985, but declined to 2% in 1995. Finally, as a result of computer, which was 27% in 1995, talking with family of adolescents rapidly decreased from just 18% in 1985 to only 7% in 1995, compared to talking with friends rose by 8% over a decade. (156)


JasS   
Mar 12, 2014
Writing Feedback / IELTS WRITING TASK 1; Annual expenditure of a British school [10]

not british, it should be British

Instead of the separation of each year, write "during a period of 20 years, from 1981 to 2001" or " between 1981 and 2001"

butHowever , ...

I haven't mentioned all mistakes!
JasS   
Mar 12, 2014
Writing Feedback / TOEFL: Which is better- Learning foreign language in home or host country? [5]

you used one phrases like " foreign language ", " in their own country " many times, use their synonyms

write with CAPITAL LETTER these words: French, German and English...

I think that you should also learn how to use articles!

I've mentioned only simple mistakes!
JasS   
Mar 12, 2014
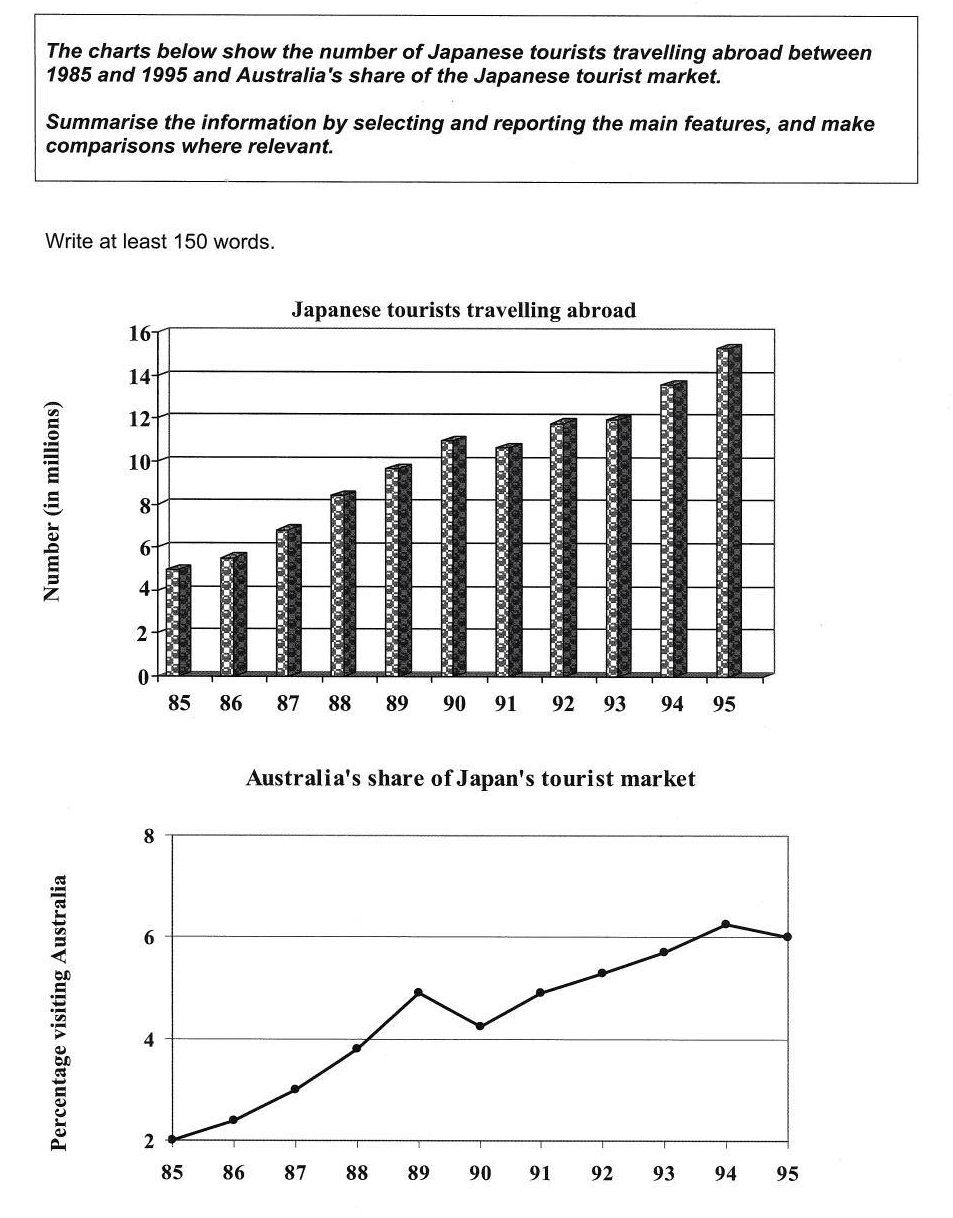
Writing Feedback / IELTS TASK 1 - Bar and Line Charts! Tourists Of Japan Travelling Abroad! [8]

The graphs compare the proportion of Japanese who travelled the oversea and allotment of Australia in tourist market of Japan during a period of 10 years, from 1995 to 1995.

Overall, while the number of tourists experienced a dramatic increase throughout the period, the percentage of people who visited Australia also climbed slightly over the 10 years as well.

In 1985, the number of Japanese who travelled abroad were less than 5 million. However, there had been a noticeable rise to more than 10 million in the proportion of Japanese tourists by 1990. Likewise, after travelers saw a bit decline, the number of travelers started to go on and reached a peak of more than 15 million at the end of the period.

Regarding the percentage of people who visited Australia increase rapidly from just 2% in 1985 to approximately 5% in 1989. Nonetheless, the figure dropped to almost 4% during a year, and it had jumped to 6% by 1995. (161)


JasS   
Mar 11, 2014
Writing Feedback / IELTS - Crime in UK; percentage of criminality of British people in different age/gender [11]

The charts compare the percentage of criminality of British people in different ages, and the number of male and female offenders in the UK.

It is clear that the largest percentage of crimes is committed by males aged 20. We can also see that prison inmate was considerably higher in men than in women.

Interestingly, just around 2% of offences are committed by males aged 10 and retirement age, compared to 0 % of criminals by females similar with age of males. The percentage of convictions experienced a rapid increase and reached a peak of 16% for men and approximately 5% for women among 20-year-olds. However, from 20 year olds to 80, the percentage of perpetration declines immediately.

As for the population of prison inmates, it is predicted that males owns the vast part of area than females. While 96 percent of all prisoners are males, the remainder are females. (150)


JasS   
Mar 10, 2014
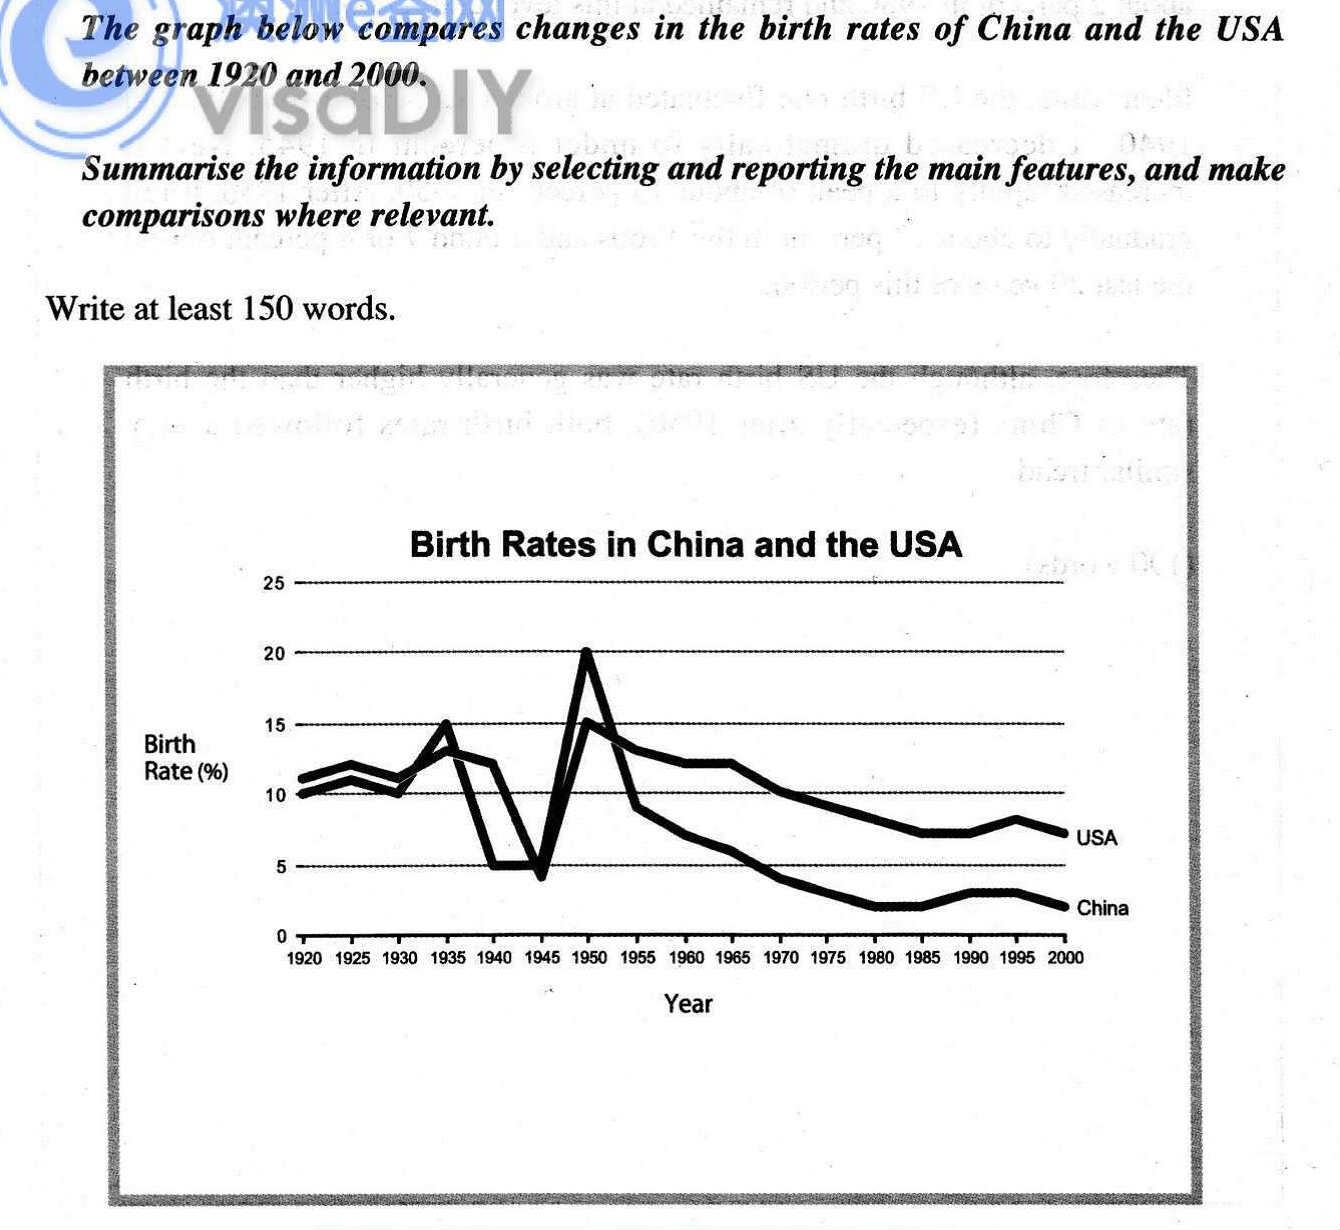
Writing Feedback / 'the figure fluctuated between 1920 and 1940' - Birth Rates in China and the USA [3]

The line graph shows that the alteration of the birth rates in different countries over a period of 80 years.

It is evident that the birth rate of each country fluctuated between 1920 and 2000. China is expected to see the most dramatic changes in its fertility.

Although the figures of China jumped markedly, there was a rapid decline during the period from 1920 to 1945. However, in 1950, the percentage of China fertility reached a peak of 20%. Interestingly, the figures of China saw a considerable fall until the end of the 2000s, to approximately 2%.

Comparing the USA fertility, we can see that the figure fluctuated between 1920 and 1940, then slide away to less than 5% and started climbing a peak of more than 15% in 1950. It is interesting that the percentage of America births saw an exponential drop until the end of the period, similar to China birth rate. (154)


Writing
Editing Help?
Fill in one of the forms below to get professional help with your assignments:

Graduate Writing / Editing:
GraduateWriter form ◳

Best Essay Service:
CustomPapers form ◳

Excellence in Editing:
Rose Editing ◳

AI-Paper Rewriting:
Robot Rewrite ◳