Writing Feedback /
IELTS: Education in Australia [2]
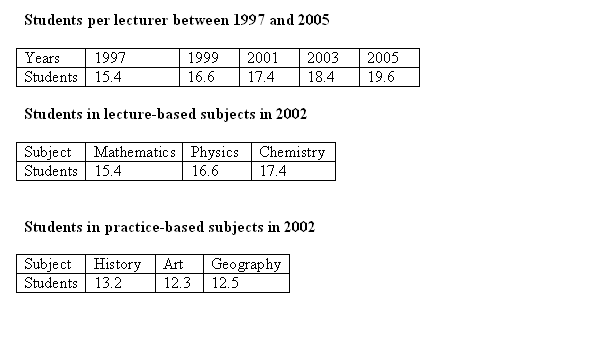
The tables show survey about education in Australia between 1997 and 2005. And then, there are two tables show subjects for student in 2002.
In general, all tables showed data about student and subject education.
The first table showed count of students per lecturer during eight years, from 1997 to 2005. The highest totally students were in 2005 with 19,6% students per lecturer. It was contrast in 1997, there were about 15,5 students per lecturer. However, we can see in the table, during eight years totally students per lecturer rose steadily.
In the second table illustrated three subjects from lecturer to students in 2002. There were Mathematics, Physics, and Chemistry. Chemistry was lecturer based subject most popular in 2002 about 17,4 %students. It was different with others. Mathematics was about 15,4% more less than Physics about 16,6% students.
The last table was almost same as the second table, it was only different in subject. In that table we can see that history was the highest subject for students practiced subject. It was about 13,2% students, different of others. Art about 12,3 % fewer than Geographic about 12,5%.
To sum up, education in Australia increased during eight years where in 2002 Chemistry and History.
australia.png

