s410377088
Oct 27, 2019
Writing Feedback / IELTS The table depicts the average distance in miles traveled by mode of travel per person per year [2]
The table depicts the average distance in miles traveled by mode of travel per person per year.
Overall, it can be seen that cars traveled the most miles in both 1985 and 2000, while the least miles traveled by people are taxis and bicycles in 1985 and 2000 respectively. It should also be noted that the biggest increase in travel distance is the car and the biggest decrease is the local bus.
With regards to the highest and lowest number of miles traveled, cars are driven about 3,200 miles and 4,800 miles per person between 1985 and 2000, whereas in 1985 taxi are traveled by each person for about 13 miles and in 2000 bicycles are traveled by each people for only 41 miles. Besides, per person took trains for travel about 300 miles in 1985 and trains traveled about 360 miles by each person in 2000.
When considering the changes of miles that each mode was used to travel, each person drove cars 1,200 more miles in one year, while local buses experienced a 160 miles decrease from 1985 to 2000.
changes in modes of travel in England between 1985 and 2000
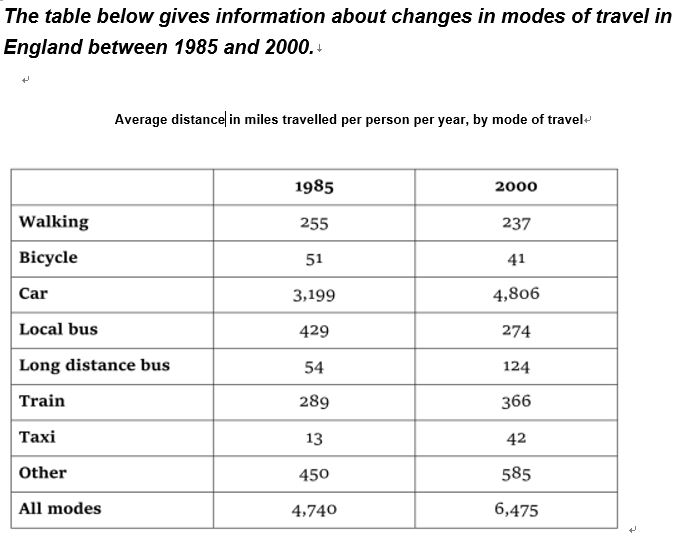
The table depicts the average distance in miles traveled by mode of travel per person per year.
Overall, it can be seen that cars traveled the most miles in both 1985 and 2000, while the least miles traveled by people are taxis and bicycles in 1985 and 2000 respectively. It should also be noted that the biggest increase in travel distance is the car and the biggest decrease is the local bus.
With regards to the highest and lowest number of miles traveled, cars are driven about 3,200 miles and 4,800 miles per person between 1985 and 2000, whereas in 1985 taxi are traveled by each person for about 13 miles and in 2000 bicycles are traveled by each people for only 41 miles. Besides, per person took trains for travel about 300 miles in 1985 and trains traveled about 360 miles by each person in 2000.
When considering the changes of miles that each mode was used to travel, each person drove cars 1,200 more miles in one year, while local buses experienced a 160 miles decrease from 1985 to 2000.
.JPG
