indah_hai
Jan 26, 2014
Writing Feedback / IELTS TASK 1; Britons fast food [4]
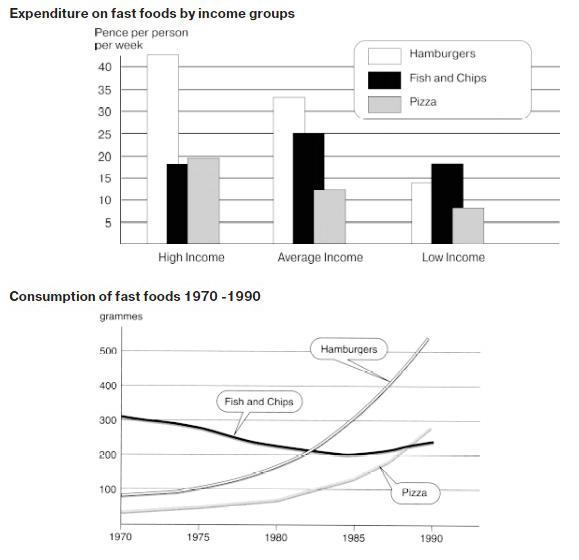
The chart below shows the amount of money per week spent on fast foods in Britain. The graph shows the trends in consumption of fast foods. Write a report for a university lecturer describing the information shown below.
The bar chart shows the changes in weekly spending by Britons on three types of keen on foods: Hamburger, Fish & Chips and Pizza, while the line graph presents the fast-food consumption during a period of 20 years, between 1970 and 1990.
According to the data, high-income and average people are likely to consume Hamburger, presented over forty-two pence per week. However, In the case of low-income people, the expenditure on Pizza as favorable food is 8 pence.
A more detailed look at the line graph shows both Hamburgers and Pizza rose steady from the first ten-period, where Hamburger had over twice as high as Pizza recording 270 grammes while Fish and Chips declined slightly from 300 to nearly 200 grammes. In contrast to the two types of fast food, by 1985 Fish and Chips remained reasonable steady, and continued to rise slightly to 270 grammes towards the end of the period.
If we analyze the data, we can see from the first graph Hamburgers were approximately two times popular than Pizza which was slightly greater than Fish and Chips. In the second graph, Hamburgers again lead Pizza which was slightly larger than Fish and Chips which were the reserve in over 20 years.


