MaximKlopunov99
Oct 28, 2016
Writing Feedback / From the bar graph, we can see the levels of participation in education and science in poor and rich [2]
Can you give me all your suggestions about this essay and the average score, please.
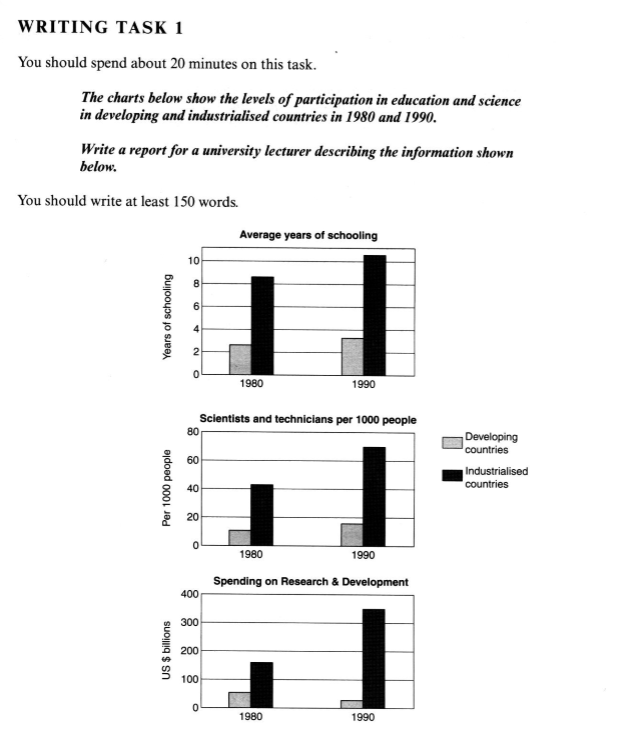
From the bar graph, we can see the levels of participation in education and science in poor and rich countries in 1980 and 1990.
Overall, the duration of schooling grew up. In developing countries, the endurance of education increased in 1 year over the decade. As for industrialised ones, it rose from 8 to almost 11 years respectively over the same period.
According to the second graph, the number of Scientist and Technician was much higher in developed countries than the developing countries. The ratio of Scientist and Technician in developing countries per 1000 people both in 1980 and 1990 was below 20, while this increased in 20 rates over the same span in developed countries.
Finally, the third graph represents that the amount spent on Research and Development in reach countries was much higher than the spending in developing countries. In 1980 the spending was around 50 billion US dollars in developing countries while this amount was more than 150 billion US dollars in developed countries. The most noticeable fact is that after 10 years the spending in Research and Development in developed countries was doubled while that amount halved in developing countries.
ielts_1.png


