Abrahamlincoln
Feb 16, 2017
Writing Feedback / The quantities of goods moved using four kinds of means in the UK between 1974 and 2002 [3]
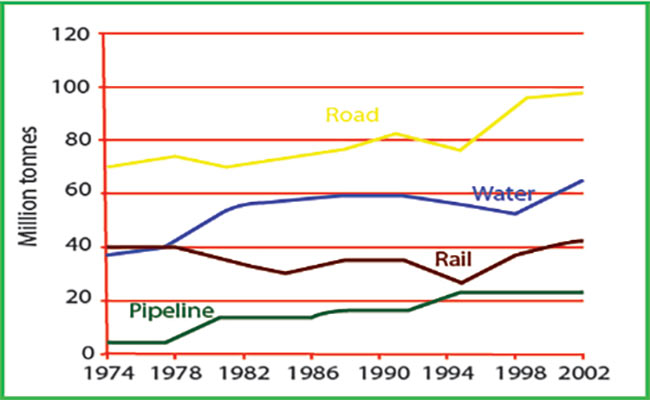
The graph below shows the quantities of goods transported in the UK between 1974 and 2002 by four different modes of transport.
The line graph compare the quantities of goods moved using four kinds of means in the UK between 1974 and 2002, measured in million tones. Overall, it can clearly be seen that pipeline was the only mode that never experienced a decrease.
Road was used for the delivery of the highest quantity of commodity in UK, starting at 70 in 1974 and ending at just under 100 in 2002. it experienced decreases twice, from 72 to 70 between 1978 and 1982 and from 82 to 79 between 1991 and 1994. Meanwhile, the least amount was sent using pipeline. at first, it stood at only 5 then it kept increasing to 21 in 1995, followed by a stable trend afterward.
in the first 4 years, water and rail were almost at the same level, around 40, but in the next 7 years whereas rail decreased to 30, water rose to just under 60. Between 1986 and 1998, the rail fluctuated between 30 and 40 while the water declined slightly to around 50. the following years saw the surge, with water witnessing more significant rise than the other.
@holt please examine this writing. million of thanks for you
The graph below shows the quantities of goods transported in the UK between 1974 and 2002 by four different modes of transport.
TRANSPORT AND DELIVERY WITHIN UK
The line graph compare the quantities of goods moved using four kinds of means in the UK between 1974 and 2002, measured in million tones. Overall, it can clearly be seen that pipeline was the only mode that never experienced a decrease.
Road was used for the delivery of the highest quantity of commodity in UK, starting at 70 in 1974 and ending at just under 100 in 2002. it experienced decreases twice, from 72 to 70 between 1978 and 1982 and from 82 to 79 between 1991 and 1994. Meanwhile, the least amount was sent using pipeline. at first, it stood at only 5 then it kept increasing to 21 in 1995, followed by a stable trend afterward.
in the first 4 years, water and rail were almost at the same level, around 40, but in the next 7 years whereas rail decreased to 30, water rose to just under 60. Between 1986 and 1998, the rail fluctuated between 30 and 40 while the water declined slightly to around 50. the following years saw the surge, with water witnessing more significant rise than the other.
@holt please examine this writing. million of thanks for you

writing_2.jpg


