faizunaa17
Sep 14, 2016
Writing Feedback / The result of adult education survey - Cambridge 1 Practice 1 - Correct if Found Some Wrong [2]
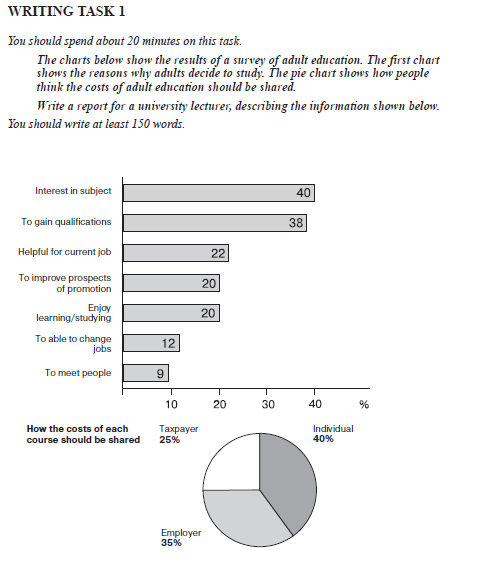
These two charts display the result of adult education survey. The bar chart is related to the motive of grown-up people to study while the pie chart shows how the cost of each course should be shared.
Overall, the main reason for deciding study are based on their interest and to get qualifications. It is clear that Individual become the highest object that get the shared cost.
Based on the first bar chart, about 40% people decide to study because they love the subject. It is slight different with another reason like getting qualification which has 38 percentage. Otherwise, only 9% of people select the course just for meet their friends.
If we look at the second pie chart, there are three categories of shared cost. The highest one is Individual that have approximately 40% of cost. In the second position there is employer that has 35%, and the smallest is Taxpayer which is only 25%.
Task1Practice1Cambri.png
