andika08
Oct 4, 2016
Writing Feedback / The pie charts gives information of survey result in 2005 and 2009 about employee and their bosses [2]
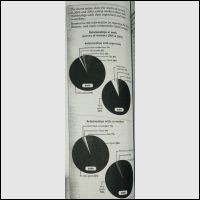
Writing Task 1: relationships at work (2005 and 2009)
The pie charts give information of survey result in 2005 and 2009 by asking employee about their relationshis with their manager and partner workers. Overall, the percentage of respon from relationship between workers and their supervisors also their workers experienced change with the different number.
Relationships with manager in 2005 and 2009 have contrast variation about percentage of respon is very pleasure for working with the manager. Three of employee answer sample rise in a number percentage. The precentage in the amount of respon called very good is 61% and 65% in different years. Beside that the precentage is decrease in the amount of respon called good is 26% and 22%.
On the other hand, Relationships with co-workers in 2005 and 2009 have slightly different about percentage of respon the question. Two of employee answer sample increase in a number percentage. The precentage in the amount of respon called very good is 63% and 70% in the first and last surveys. Meanwhile the percentage is drop in the amount of respon called good is 28% and 25%.

284504_1.jpg


